Ralph Lauren Set to Release Earnings with Positive Projections
Note: Ralph Lauren’s FY’25 ended March 2025.
Earnings and Revenue Projections
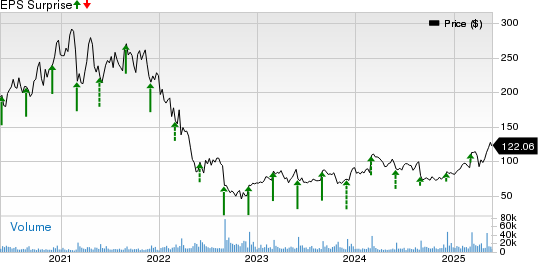
Ralph Lauren (NYSE: RL) is expected to announce its fiscal fourth-quarter earnings on Thursday, May 22, 2025. Analysts forecast earnings of $2.40 per share, accompanied by revenue of $1.65 billion. This represents a 45% increase in earnings year-over-year and a 5% rise in sales compared to previous year figures of $1.41 per share and $1.57 billion in revenue. Historically, RL stock has shown a 63% success rate for price increases following earnings announcements, with an average one-day gain of 4.4% and a peak return of 17%.
Guidance and Financial Outlook
The luxury apparel brand has raised its full-year constant currency revenue growth forecast to 6–7%. Additionally, it anticipates an improvement in operating margins of 120–160 basis points. Ralph Lauren plans to maintain marketing expenses at around 7% of revenue and aims to launch its next-generation transformation initiative in fiscal 2027. In terms of Q4 2025 projections, the company expects similar revenue growth of 6–7% in constant currency and an operating margin expansion of 120–140 basis points.
Currently, Ralph Lauren holds a market capitalization of $17 billion, with trailing twelve-month revenue of $6.9 billion, an operating income of $926 million, and net income of $705 million.
Market Strategies for Traders
For event-driven traders, historical earnings patterns can inform strategic positions before releases or guide responses after announcements. If you prefer lower volatility compared to individual stocks, the Trefis High-Quality portfolio may serve as an alternative. This portfolio has outperformed the S&P 500 with returns exceeding 91% since its inception.

Photo by jarmoluk on Pixabay
Ralph Lauren’s Historical Odds of Positive Post-Earnings Returns
Here are some observations about one-day (1D) returns following earnings announcements:
- Over the last five years, there have been 19 earnings data points. Of these, 12 were positive and 7 negative, indicating that positive returns occurred 63% of the time.
- This percentage increases to 75% when focusing on the last three years.
- The median increase for the 12 positive returns is 4.4%, while the median decrease for the 7 negative returns is -4.8%.
Additional data on observed 5-Day (5D) and 21-Day (21D) returns following earnings will be summarized in the following table.
Analyzing Correlation in Historical Returns Post-Earnings
Understanding Correlation: 1D, 5D, and 21D Historical Returns
Implementing a lower-risk strategy involves examining the correlation between short-term and medium-term returns after earnings announcements. By identifying a pair of correlating metrics, traders can make informed decisions. For instance, if the one-day (1D) returns closely correlate with the five-day (5D) returns, a trader might consider going long during the subsequent 5-day period if the 1D post-earnings return appears positive. The following data illustrates the correlation based on 5-year and more recent 3-year histories. Here, 1D_5D denotes the correlation between the 1D post-earnings returns and the following 5D returns.

RL Correlation Between 1D, 5D, and 21D Historical Returns
Correlation with Peer Earnings
Peer performance may impact stock reactions following earnings announcements. In some cases, the market pricing may begin before the earnings are officially reported. The following historical data compares Ralph Lauren’s post-earnings performance with the stock performance of peers that reported earnings shortly before Ralph Lauren. For a fair analysis, the peers’ stock returns also reflect one-day (1D) post-earnings returns.

For further insights, you can explore Trefis RV strategy, which has shown strong performance compared to an all-cap stocks benchmark, consisting of the S&P 500, S&P mid-cap, and Russell 2000.
The views and opinions expressed herein are solely those of the author and do not necessarily reflect those of Nasdaq, Inc.

