Hope Springs Eternal
As a Chicago Cubs fan, I’ve long subscribed to the “hope springs eternal” mindset. On Thursday afternoon, I’ll head to Wrigley Field with my 11-year-old son and “root, root, root for the Cubbies.”
In my mind, there are powerful analogies between baseball and capital markets. In both cases, the path is long and there’s a ‘game within the game.’ These American pastimes reward patience, discipline, consistency, and a focus on perspective.
here and now, Nasdaq-100 Index® Options (NDX®) pricing may present a relative value opportunity for discerning traders.
Evolution
Investing and baseball have evolved dramatically over the past two decades. The shifts have largely been driven by quantitative analytics.
Sabermetrics upended the old guard in baseball. There was an equivalent transformation in capital markets as technology enabled access and computing power made many “position players” anachronistic.
The options markets experienced tremendous growth from these changes. Individual investors can easily access an ultra-competitive market with minimal friction. Institutional traders can manage risk using centrally cleared, listed contracts with durations from days to nearly a decade.
Drawdowns (& Recoveries)
Volatility is often described as “the price of admission” for investing. That’s accurate. Volatility is constant…and bi-directional. The rate of change is often positive, but recently, there’s been a pickup in downside volatility.
Most major U.S. indexes slipped below their 200-day moving averages (MA). The Nasdaq-100 Index® (NDX®) has declined during nine of the twelve weeks in 2026. Every weekly closing since February 20th (standard expiration) has been lower.
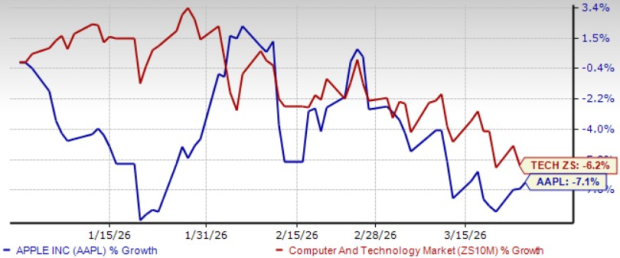
Based on sentiment metrics, investors are as bearish as they’ve been since early April of 2025 (tariff tantrum). The chart below plots NDX price performance in blue and the AAII Bull – Bear spread going back to January of 2020.

Source: YCharts
- Will the 200-day MA become upside resistance?
- Do we need a market “flush” for a sense of capitulation?
- Are we in for a prolonged bear market like the 2022 dynamic?
- Could there be a clear resolution with Iran and a snapback rally?
While these questions lack definitive answers, the options market offers a lens into how participants are pricing risk, and where potential opportunities may lie.
Relative Value
In times like these, I’m reminded of an early career risk manager’s insight. I can still hear him in my head a quarter of a century later:
“Something is only cheap or expensive relative to itself or something else.”
He was talking about option volatility, but the concept could be applied broadly. Prices reflect a supply/demand that’s dynamic.
In demand options will naturally see their values bid up.
Well supplied options will see the opposite.
The relationship between high and low demand options may present opportunities for savvy end users.
Let’s evaluate the relationship between two NDX options through time. Below, we’re looking at 1-month options (constant) and comparing 10% out-of-the-money (OTM) calls (IV terms) to the at-the-money (ATM) options.

Source: Bloomberg
Understand that the relationship (10% OTM call IV – ATM call IV) is almost always negative. In other words, ATM implied volatility typically trades above OTM calls. Equity index skew lends itself to that overwhelming tendency.
Over the past decade, on average, the relationship has been a 3 vol discount for the 10% OTM calls. That spread rarely moved above zero or below -6. When it did, things were arguably ‘interesting,’ suggesting the market may have mispriced upside potential.
Earlier in March, the spread briefly moved to ~12 vols wide and it remained around 9.5 vols.
Current example: NDX April 22nd expiration (30 DTE)
|
ATM 24,000 strike |
IV = 25% |
Spread |
|
10% OTM 26,400 strike |
IV = 15.5% |
9.5 vols |
Source: Bloomberg
Relative to the ATM volatility, the 10% OTM options screen as “cheap.”
The sample set of historical occurrences is very small (n = 1), so it should be treated anecdotally as opposed to a pattern. When a similar “discount” happened (3/16/2020), NDX closed at 7,020. A month later (4/16/2020), NDX closed at 8,757. The index gained nearly 25% within 30 days.
To be fair, NDX does not typically jump 10% or more in a month. Based only on calendar months (as opposed to rolling 30-day windows), there have been 6 such instances going back to 2020. There were two months with gains of between 9-10%.

Source: Nasdaq
As most option users know, you wouldn’t necessarily need to see a 10% rally or more for those options to be profitable if there was a sufficient move higher ahead of expiration and an opportunity to monetize.
There’s also XND options available with 1/100th the exposure of the full-sized index.
Relative-Relative Value
As someone who frequently works with NDX options, I’m often asked the question: why shouldn’t I just use S&P options (SPY)?
My responses vary, depending on some follow up, but here’s a current example of why the reference asset/product choice matters.
In short, the 1-month 10% OTM NDX calls are lower than the 1-month 10% OTM SPY calls. Over a 5-year lookback, those NDX options average ~4.33 volatility premium compared to like SPY options. As of late March (24th) – the NDX options are trading just 1.55 vols over the SPY alternative.

Source: Pricing Monkey
Bringing It Home
Successful investors and traders don’t swing for home runs. They look to get on base. Using a Chicago Cubs analogy, a great trader would look like Nico Hoerner. He’s the all-star second baseman who hits for contact, has speed, plays incredible defense, and takes the field nearly every day. He also rarely hits home runs.
There are 162 games in an MLB season. Hoerner played in 156 of them. He led the team in batting average and on-base percentage, had the fewest strikeouts, and earned a gold glove for his defense.
Nico plays smart (he did go to Stanford after all) and is always looking for an edge. There’s a lesson in this for both ball players and risk managers.
It’s a long season. Keep yourself in the game and keep coming back.