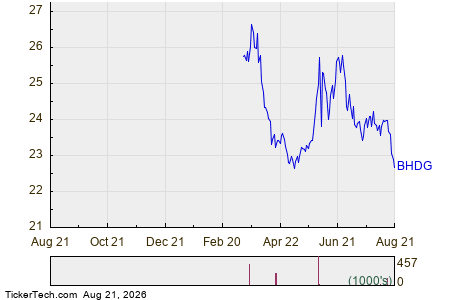
On Friday, shares of the BHDG ETF (Symbol: BHDG) traded as low as $22.66, entering oversold territory with a Relative Strength Index (RSI) of 28.0, indicating heavy selling pressures. This contrasts with an RSI of 54.2 for the S&P 500. An RSI below 30 is viewed as oversold, which could signal that the selling may be exhausting, prompting bullish investors to consider buying opportunities.
BHDG’s 52-week range shows a low of $22.65 and a high of $26.67, with recent trading at $22.69, reflecting a daily decline of about 1%. The ETF’s performance suggests it is nearing the lower end of its historical range, highlighting potential interest for investors seeking entry points.
5 Stocks Our Experts Predict Could Double In the Next Year
By submitting your email, you'll also get a free pivot & flow membership. A free daily market overview. You can unsubscribe at any time.