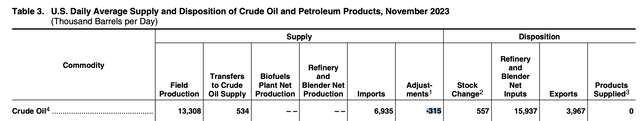
EIA’s recent report on U.S. oil production for November marks another record high in production, with figures reaching ~13.308 million b/d. However, a closer look reveals a different story. The adjustment factor of -315k b/d means that the actual effective U.S. oil production figure for November was 12.993 million b/d.
Understanding the Adjustment Factor
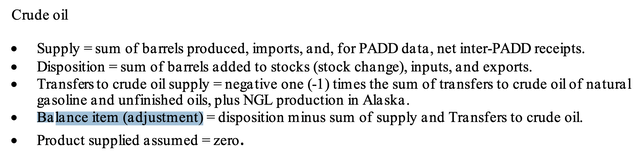
The adjustment is an essential balancing item in the EIA’s reporting. It accounts for varying factors such as storage levels, refinery throughput, crude exports and imports, and new transfers to crude oil.
This process becomes especially complex when considering U.S. shale’s dominance by NGLs, making it challenging to fully grasp the nation’s oil production. To address this, EIA implemented a new process at the start of 2023 in an attempt to eliminate the adjustment factor.
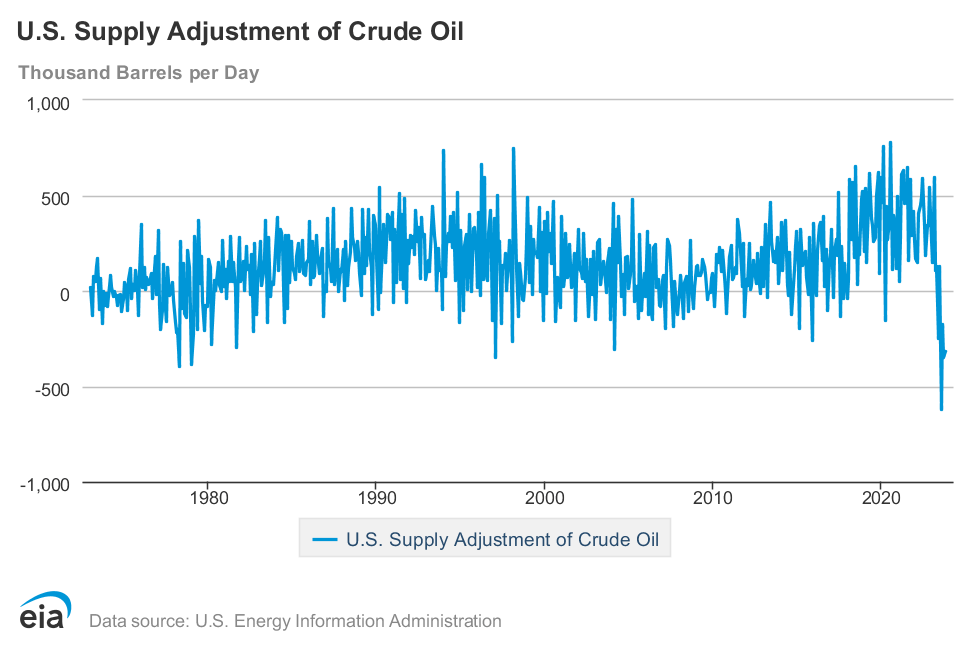
Since June 2023, the monthly reports have shown a significant downward shift in the adjustment factor. This can be attributed to two reasons – increased U.S. crude exports leading to higher blending values and EIA’s overestimation of U.S. oil production in an effort to eliminate the adjustment.
Challenges in Production Figures
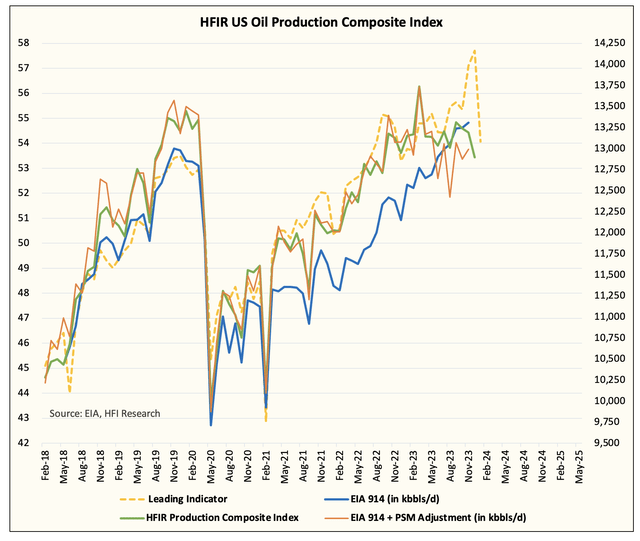
While EIA’s efforts to rectify the constant positive adjustment factor are commendable, they seem to have over-corrected the production side. Analysis of the U.S. oil production matrix suggests that Q4 2022 U.S. oil production was likely understated at 12.315 million b/d.
The underestimation has led to several issues, including overstating the growth from year-end 2022 to 2023 and creating a false perception that U.S. shale is set to rival OPEC+’s market share.
Revealing the Reality
The actual growth in U.S. oil production from Nov 2023 to Nov 2022 was only 400k b/d to 500k b/d, highlighting an inability to keep pace with the growth in associated gas production.
Understanding Real Production Levels
For December, our U.S. oil production tracker shows ~12.896 million b/d, signaling much lower growth than represented in the headline figures. This disparity questions the accuracy of forecasts and balances by notable entities such as IEA, OPEC, and EIA.
US Oil Production: A Bleak Outlook
For readers, the most important takeaway from our article is the massive disparity in growth. The fact that headline figures show +1 million b/d versus our real implied +371k b/d should be alarming, and that’s why we are pounding the table here.
Significant Revisions in US Oil Production Expectations
There’s a lot to unwrap here, but this article would be meaningless if we didn’t explain what that means going forward. So here’s what we see:
- Q1 2024 U.S. oil production should meaningfully surprise to the downside. Previously, we expected an average of 12.8 to 12.9 million b/d, but with December production already averaging ~12.9 million b/d, we see the average closer to ~12.7 to ~12.8 million b/d.
- This also materially lowers our projections for year-end 2024 down from 13.6 million b/d to 13.2 million b/d. For the rest of 2024, we think EIA will report flat headline production figures. We do expect U.S. shale to still grow this year.
- Associated gas production will completely decouple from U.S. shale oil production. Over the entirety of 2024, we should see associated gas production remaining elevated, while oil production lags.
- Capex guidance out of U.S. shale oil producers will increasingly point to a flat growth projection. The growth is almost entirely gone.
- By 2025, peak U.S. shale will have arrived, with the majority of the growth evaporating. With associated gas production still outpacing crude oil production growth, U.S. oil production will have peaked between 13.2 to 13.5 million b/d.
As for the oil market, if demand growth continues at just a measly ~1 million b/d post-2025, the burden will have to fall on OPEC+ to fulfill most of that gap. Canada, Guyana, and Brazil will be unable to fill that gap. Once U.S. shale is tapped, that’s when the real oil supercycle begins.
So we hope this article helped explain the ugly truth we are seeing in U.S. oil production. The headline growth is not what it seems, and sadly, we don’t think a lot of people follow the data closely enough to know what’s really going on.