Walmart WMT shares took a hit in response to the latest quarterly release on November 16th when the company offered guidance that fell slightly short of expectations. The period of tumultuous trading that followed saw the stock lose over 10% of its value. However, in a marked turnaround, Walmart shares have since rebounded and are presently trading at a 52-week high, outperforming the market by a significant margin since the beginning of January 2024.
The upcoming quarterly results on Tuesday, February 20th will reveal whether this performance momentum can be sustained. It wouldn’t be surprising to witness a ‘sell-the-news’ reaction, similar to the one following the November 2023 release.
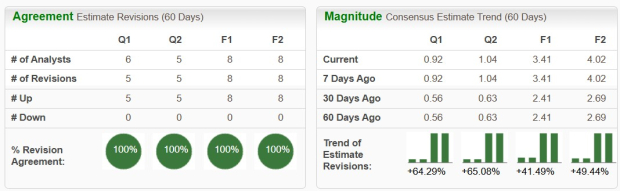
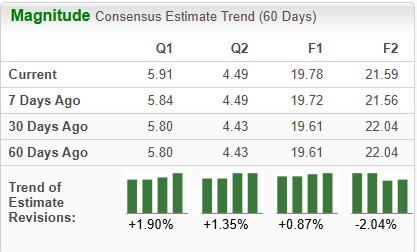
Analysts are gearing up for Walmart’s earnings of $1.65 per share on $170.6 billion in revenues, indicating year-over-year changes of -3.5% and +4%, respectively. Notably, the $1.65 estimate is an increase from $1.63 per share a few days back.
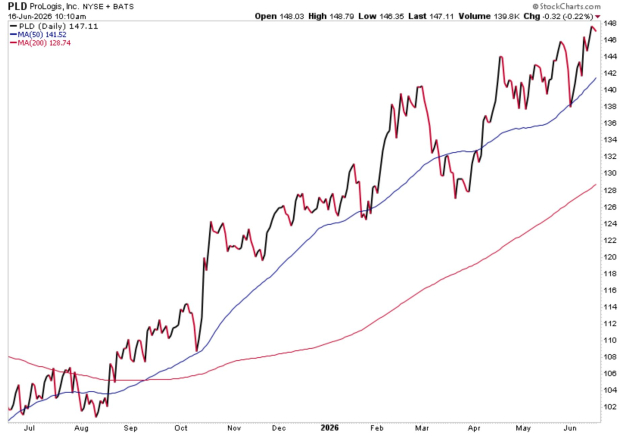
Target TGT isn’t expected to report quarterly results till March 5th, while Home Depot is set to report results Tuesday morning alongside Walmart. The performance of Walmart, Home Depot, and Target relative to the S&P 500 index over the past year is illustrated in the chart below.
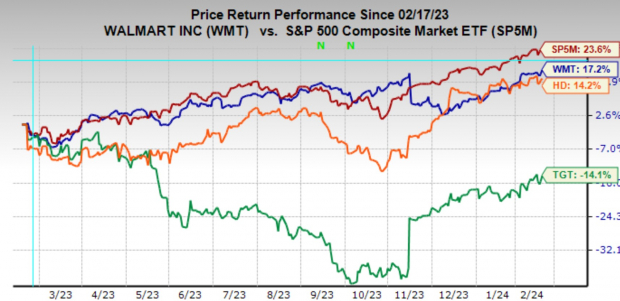
Image Source: Zacks Investment Research
The Retail sector’s 2023 Q4 earnings season scorecard reveals that results from 17 of the 33 retailers in the S&P 500 index are already in. This sector is separately classified in the Zacks economic sector, distinguishing itself from the Consumer Staples and Consumer Discretionary sectors in the Standard & Poor’s standard industry classification.
In addition to traditional retailers, the Zacks Retail sector encompasses online vendors like Amazon AMZN and restaurant players. The 17 Zacks Retail companies in the S&P 500 index that have reported Q4 results belong to the e-commerce and restaurant industries. Total Q4 earnings for these 17 retailers are up +72.4% from the same period last year on +10.7% higher revenues, with 88.2% beating EPS estimates and 58.8% beating revenue estimates.
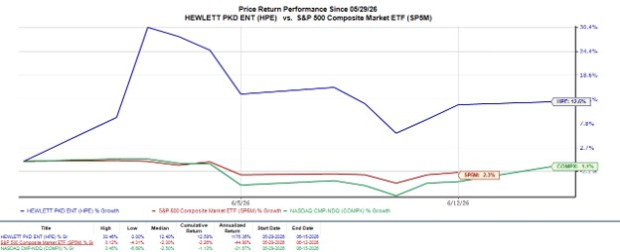
The Q4 beats percentages for these retailers are contextualized in the comparison charts, highlighting their historical performance.
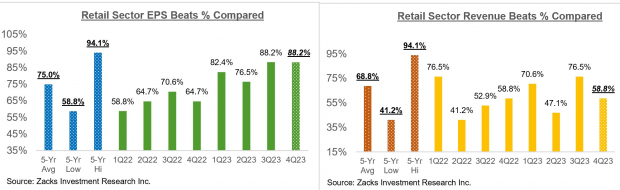
Image Source: Zacks Investment Research
The charts reveal that online players and restaurant operators have easily exceeded EPS estimates but have struggled to surpass revenue estimates. Notably, Amazon’s phenomenal Q4 performance—up +410.9% on revenues up by +13.9%—substantially contributes to this remarkable earnings and revenue growth.
The ongoing convergence of digital and brick-and-mortar retail, amplified by the Covid lockdowns, has significantly transformed the retail landscape. Amazon has evolved into a substantial brick-and-mortar operator following its acquisition of Whole Foods, while Walmart is steadily expanding as an online vendor. The impending Q4 earnings calls are expected to shed more light on this matter, particularly in the context of the companies’ outlooks for the coming periods.
Standout Features of the Q4 Earnings Season
The Q4 earnings season has underlined the industry’s overall stability and resilience. Though corporate profitability was not robust, it has been relatively sturdy. The fear of an impending earnings cliff has somewhat dissipated.
With over 79% of S&P 500 members having released their quarterly results, the following key features have been confirmed:
First
The Q4 earnings and revenue growth pace represents an acceleration from recent quarters, a significant indicator of the industry’s future trajectory.
For the 396 S&P 500 members that have reported results, total earnings and revenues are up +5.1% and +3.4% from the same period last year, respectively. Beat percentages are also relatively favorable, with 78.8% of the companies surpassing EPS estimates and 64.4% exceeding revenue estimates.
The comparison charts contextualize the Q4 earnings and revenue growth rates for these 396 index members, offering a historical perspective.
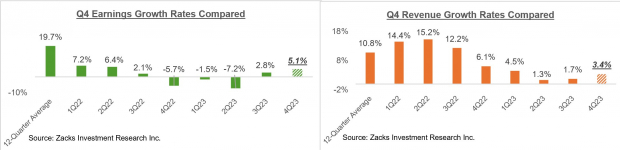
Image Source: Zacks Investment Research
Second
Companies have made notable progress on the margins front. The year-over-year change in net margins turned positive in 2023 Q3 after being negative for six consecutive quarters, becoming a key driver of earnings growth in subsequent periods.
This upturn in margins is demonstrably reflected in the chart below.
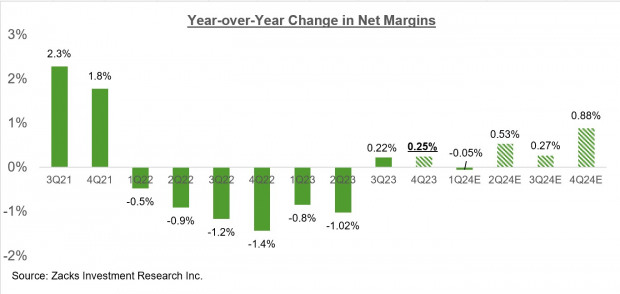
Image Source: Zacks Investment Research
The robust performance and underlying trends indicate a resilient industry positioning itself for growth in the coming periods. As the upcoming retail earnings season unfolds, investors eagerly await the revelations that will determine their next steps in this ever-evolving marketplace.
The Rise and Resilience of Tech in Q4 Earnings
The fourth-quarter earnings season has brought an array of performances from different sectors, painting a diverse picture of the market’s health.
Positive and Negative Sector Movements
Positive movements have been noted in the Tech, Consumer Discretionary, Retail, Industrial Products, Utilities, Finance, and other sectors, with their margins showing a notable upturn. Conversely, declines have been observed in the Medical, Autos, Energy, and Transportation sectors, indicating a divided landscape.
Tech Sector on the Upswing
The standout is the Tech sector, which has made a strong comeback, signifying a potent resurgence. It is a key contributor to the S&P 500 index and appears to continue to have a profound impact on the aggregate picture, with the sector’s Q4 earnings poised to set a record high.
The segment’s performance is pivotal for maintaining positive growth in Q4, with its exclusion leading to a marked decline in the overall results. This resurgence marks a significant return to the historical norm for the sector, which had been a drag in the market’s overall growth trend.
Furthermore, the Tech sector’s growth has a substantial influence on the aggregate picture, encompassing both positive and negative outcomes for the market.
The Dominance of the Magnificent 7
Another notable trend is the dominance of the so-called ‘Magnificent 7’ companies – Apple, Amazon, Alphabet, Microsoft, Meta, Nvidia, and Tesla. These companies have collectively exhibited strong performances, positioned as influential market drivers, with robust earnings and a significant impact on the S&P 500 market capitalization.
The notable influence of these industry giants further underscores the pivotal role of the Tech sector and its impact on the broader market dynamics.
Resilient Revision Trends
Despite initial concerns, the revisions trend has seen stabilization, with modest adjustments in estimates for 2024 Q1 and the full-year 2024. This balancing act involves negative revisions from some sectors being counteracted by positive revisions from others, a further indication of the market’s resilience.
For a detailed look at the overall earnings picture, including expectations for the coming periods, please check out our weekly Earnings Trends report >>>> Q4 Results Paint a Positive Earnings Picture
7 Best Stocks for the Next 30 Days
Just released: Experts distill 7 elite stocks from the current list of 220 Zacks Rank #1 Strong Buys. They deem these tickers “Most Likely for Early Price Pops.”
Since 1988, the full list has beaten the market more than 2X over with an average gain of +24.0% per year. So be sure to give these hand-picked 7 your immediate attention.
Reflecting on the recent market developments, these insights cast an illuminating light on the diverse movements across different sectors. Despite mixed trends, the market’s ability to adapt and rebound highlights its underlying resilience and capacity for growth in the face of challenges.
It’s clear that trends evident in the Tech sector and dominant companies have pivotal implications for the overall market dynamics, offering a source of both resilience and potential for the broader market.
The current market movements reflect an intricate and nuanced tapestry, underscoring the importance of adaptive strategies and a keen eye on the ever-evolving market landscape.
While some sectors experience fluctuations, the market’s innate agility and capacity for resurgence are underlying themes, portraying a dynamic and adaptive ecosystem.
As we navigate this intricate landscape, it’s evident that astute interpretations of sector movements are crucial for stakeholders to calibrate their investment decisions and harness the market’s resilience for sustained growth.
Ultimately, these insights serve as a guiding compass for navigating the complex market dynamics, offering invaluable cues for strategic decision-making in the realm of investment and markets.
In essence, the variegated sector performances encapsulate the essence of the market’s intricate and ever-evolving nature, highlighting the need for agility and resilience in the pursuit of sustainable growth.
As we traverse the enigmatic terrain of the market, these insights shed light on the nuanced interplay of factors underlying sector movements, enriching our comprehension of the dynamic market landscape.
5 Stocks Our Experts Predict Could Double In the Next Year
By submitting your email, you'll also get a free pivot & flow membership. A free daily market overview. You can unsubscribe at any time.