
The Recent PCE Inflation Report: Analysis and Market Outcomes
This morning’s Personal Consumption Expenditures (PCE) price index report met expectations, with a rise of 0.3% in January and 2.4% year-over-year. Core PCE inflation, excluding food and energy prices, showed a 0.4% monthly increase and a 2.8% yearly rise. Notable details from the report reveal services prices up by 0.6% on the month and a 3.9% increase over 12 months, contrasting with a 0.2% drop in goods prices monthly and a 0.5% decrease yearly.
While food prices saw a 0.5% surge, energy experienced a 1.4% decline. Year-on-year figures showed a 1.4% uptick in food prices and a 4.9% decrease in energy costs.
Market Response and Future Projections
The market reacted positively to the report, in stark contrast to the recent chaos induced by unexpected CPI data. The numbers don’t prompt the Federal Reserve to hasten or slow rate adjustments, resulting in stable market conditions. The Dow remains steady, with the S&P and the Nasdaq showing gains. Analysis on the CME Group’s FedWatch Tool indicates no significant changes in rate cut expectations.
While the data act as a potential obstacle dodge for now, short-term market challenges persist. Yet, a closer look at the S&P’s technical analysis hints at reasons for optimism and further market highs.
Unlocking Market Forecasts through Stage Analysis
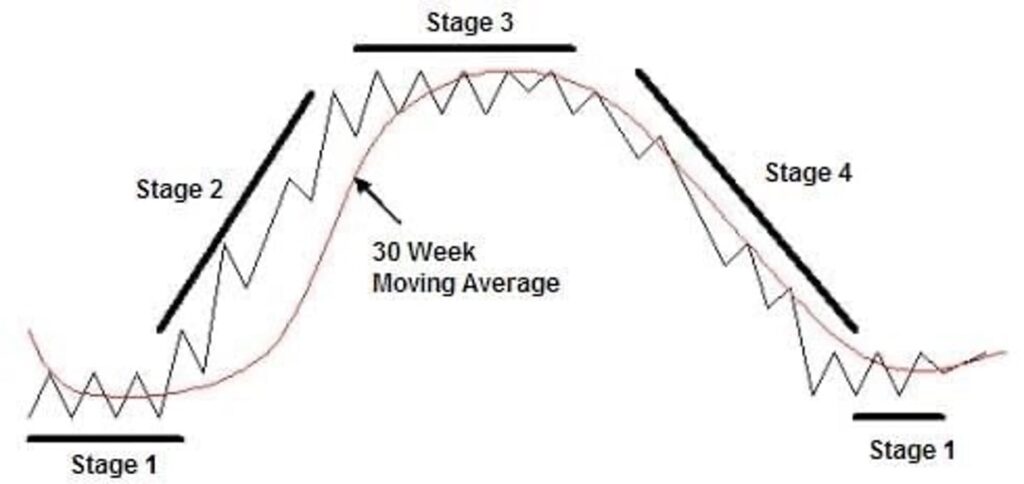
Stage Analysis, employed by trading expert Luke Lango in his services, AI Trader and High Velocity Stocks, categorizes stocks into four stages: bottomed sideways, upward momentum, topped sideways, and downward spiral. This strategy forms the basis for strategic investments based on current market positioning.
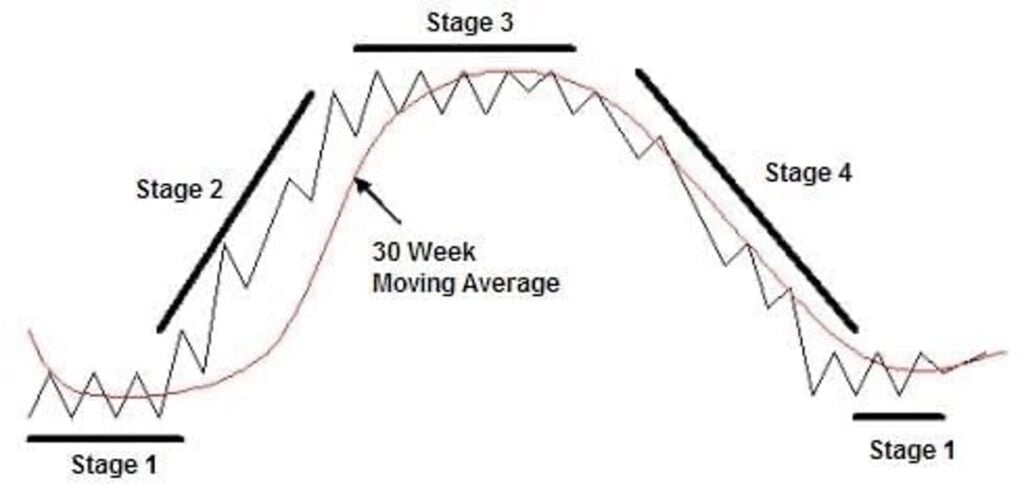
A successful approach involves identifying or anticipating stocks on the brink of entering Stage 2 or those already exhibiting breakout signals within that stage. Conversely, it is crucial to rid portfolios of stocks in Stage 4 or those edging towards a breakdown.
The Current State of the S&P Index
Since the fall of 2022, the S&P has shown a Stage-2 breakout pattern. However, within breakouts, cyclic peaks and troughs are inevitable. The index presently hovers near the top of its breakout channel, commonly termed as “resistance.” Historically, each surge to this resistance level has been accompanied by a retreat, signifying a trend reversal.
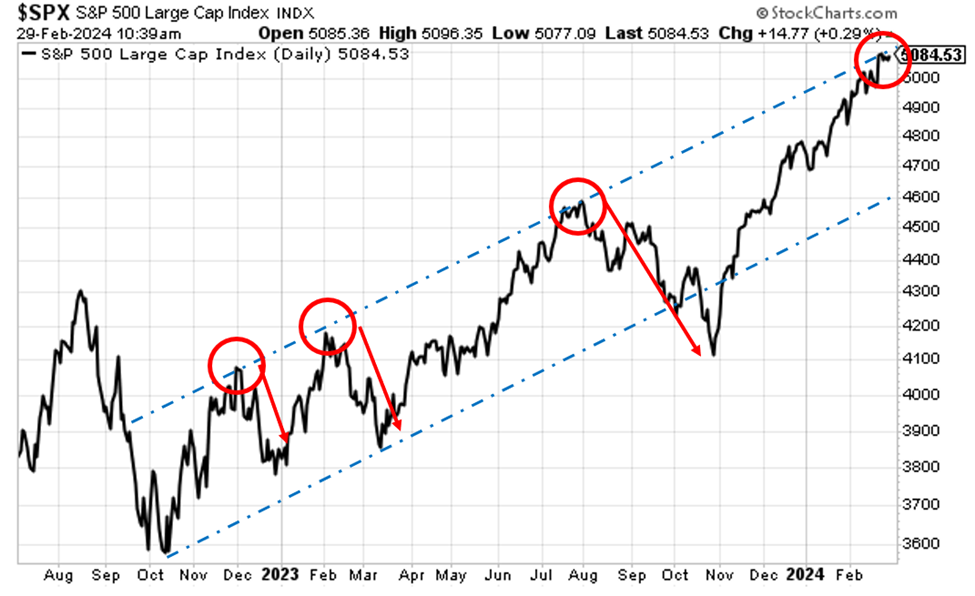
Source: StockCharts.com
The initial pullback after hitting resistance amounted to around 7%, followed by an 8% drawdown. The subsequent retracement marked the most significant dip,
Insights on Market Corrections and Indicators
The recent turbulence in the market has left many investors on edge, with the S&P experiencing an 11% correction. Such pullbacks have a way of unsettling even the most seasoned investors, necessitating emotional readiness for what lies ahead. Historical data suggests that an 8% or 9% correction should not catch us off guard.
Key Technical Indicators to Watch
Within the realm of trading, technical indicators play a crucial role in guiding decisions. The Relative Strength Index (RSI) and the Moving Average Convergence/Divergence (MACD) indicator are two such tools that Luke frequently relies on for insights. The RSI gauges the momentum of an asset, indicating overbought or oversold conditions. Contrastingly, the MACD reflects changes in a price trend’s strength and direction. These indicators offer valuable signals, with crossovers and divergence patterns hinting at potential shifts in asset direction.
Revealing Divergences as Harbingers of Change
While the conventional use of RSI and MACD is to identify overbought or oversold levels, these indicators can also act as precursors of impending changes in trend direction. Divergences between the RSI/MACD trends and the asset’s price often signal a weakening of the existing trend. Structural shifts become evident when the asset’s price moves in opposition to the RSI and MACD. Such scenarios historically foretell corrections in the market, emphasizing the importance of attentiveness to these technical cues.
Interpreting Long-Term Patterns
Market analysis extends beyond short-term fluctuations, delving into longer trends to uncover deeper insights. By revisiting historical data, we can unearth patterns that provide a broader perspective. For instance, the notion of a Stage-2 breakout since the fall of 2022 may be challenged upon considering a potential co-Stage-4/Stage-3 hybrid phase preceding the current breakout. The market’s recent surge might be seen in a different light, reflecting a shift in volatility rather than a sustained Stage-2 advancement.
At the forefront of our analysis lies the critical level of 4,800 on the S&P, a former resistance now turned potential support area. While an anticipated correction looms, monitoring this level becomes paramount. Should the market undergo a temporary setback, the resilience of this level will be closely watched, hinting at future bullish momentum once short-term headwinds dissipate.
Market dynamics are ever-evolving, presenting investors with a rollercoaster of sentiments and outcomes. By navigating the intricate web of technical indicators and historical patterns, we equip ourselves with the tools to weather market storms and seize opportunities amidst the chaos.
Investment Joy: Two Subscriptions Celebrate Major Success!
As the financial markets continue their ebb and flow, investors everywhere are seeking refuge in the turbulent waters of volatility. Amidst this uncertainty, recent developments have left subscribers of High Velocity Stocks and Ultimate Crypto celebrating monumental success.
Luke’s High Velocity Stocks Subscribers Reap the Rewards
Within the realm of biotech stocks, where unpredictability reigns supreme, Luke’s High Velocity Stocks subscribers find themselves basking in the glow of a remarkable stage analysis framework. The biotech sector, known for its capricious nature, has suddenly tilted in favor of bullish traders, unleashing a wave of unprecedented gains.
Glancing at Luke’s trading portfolio, the numbers speak volumes – each of the 10 positions proudly flaunts profits, with three boasting gains exceeding 100%. Ardelyx has surged by a staggering 146% since August, while ADCT Therapeutics and Applied Therapeutics have recorded magnificent gains of 153% and 160%, respectively, in remarkably short timeframes.
This confluence of a stage analysis framework and a volatile sector has birthed a meteoric rise, prompting Luke to declare a “2024 Biotech Boom”. With the winds of the market blowing favorably for biotech stocks, subscribers are set to reap the rewards of this opportune moment.
The Crypto Craze: Triumph for Ultimate Crypto Subscribers
Simultaneously, the enigmatic world of cryptocurrencies is experiencing a seismic upheaval, with Bitcoin flirting with its historical highs and the entire sector surging. Within this digital maelstrom, Luke’s subscribers of Ultimate Crypto find themselves on the cusp of unparalleled success.
Bitcoin’s staggering 48% surge in February is nothing short of monumental. Leading altcoins, including the likes of Celo, have followed suit, painting a picture of soaring value. Luke optimistically predicts a prolonged period of growth, offering investors the tantalizing prospect of multiplying their investments tenfold over the coming year.
The jaw-dropping success stories within Luke’s Ultimate Crypto portfolio, featuring positions soaring by 1,776% and 2,268%, serve as a testament to the potential hidden within the crypto market. The early signs of substantial gains have set the stage for a future replete with profits for subscribers.
As the financial market whirls in a cacophony of activity, investors in both High Velocity Stocks and Ultimate Crypto find themselves at the helm of a prosperous journey. The markets may be tempestuous, but within the storm lies the promise of riches.
Stay tuned for further updates on these exciting developments!
Warm regards,
Jeff Remsburg


