The S&P 500 is still within 2% of its record closing high reached exactly two years ago on January 3rd, but beneath the surface, there have been some big moves.
Average Activity
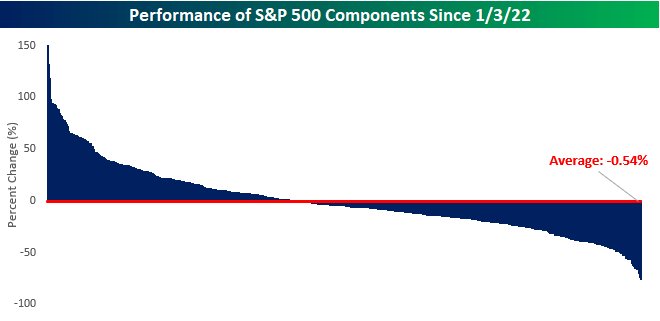
The chart below shows a distribution of two-year returns for every S&P 500 stock that is currently in the index, and while there have been some big winners and losers over this period, the average component’s move has been just a modest decline of 0.54%.
So while the S&P 500 is down 1.9% from its high, over that same period, the ‘average’ stock in the index is down even less.
For all the talk over the last year about how narrow the market has been, over the last two years that hasn’t been the case.
Winners and Losers
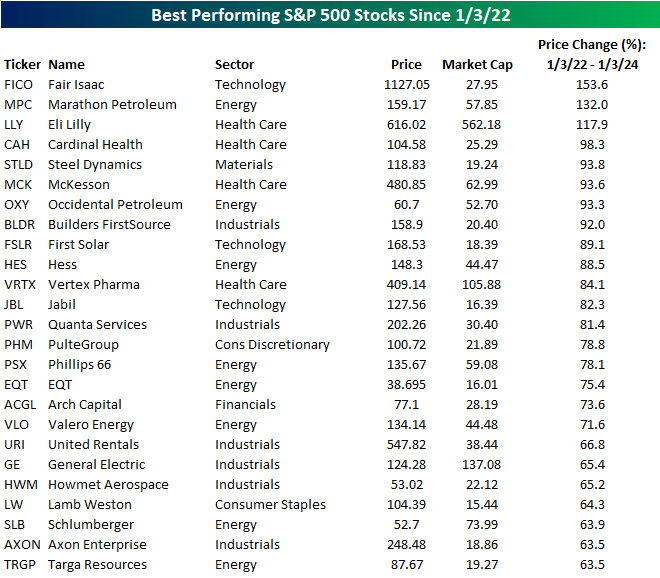
In the tables below, we show the 25 best and worst-performing stocks in the S&P 500 over the last two years. Starting with the winners, all of the stocks listed have rallied at least 63%, and there are another 14 stocks that are up over 50% that didn’t make the list.
Perhaps what stands out most about the list of biggest winners is what stocks aren’t on it.
As shown, only three Technology sector stocks (and no Communication Services sector stocks) made the list, and of those three, not even one has a market cap of more than $30 billion.
The only mega-cap stock on the list is Eli Lilly (LLY), showing again how while mega-cap tech had a great 2023, on a ‘two-year stack,’ their performance has been unremarkable.
While tech stocks weren’t well-represented on the list, Energy and Industrials filled the void with eight and six stocks, respectively.
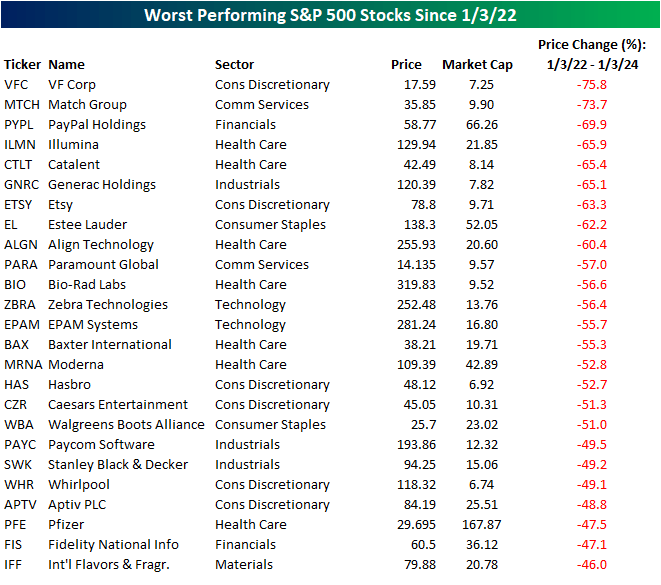
Among the list of biggest losers over the last two years, 18 are down over 50% led lower by V.F. Corp. (VFC) and Match Group (MTCH) which have both plummeted more than 70%.
Both of these stocks now have market caps of less than $10 billion, and of the 25 names shown, only three (PayPal (PYPL), Estee Lauder (EL), and Pfizer (PFE)) have market caps above $50 billion.
Original Post
Editor’s Note: The summary bullets for this article were chosen by Seeking Alpha editors.
5 Stocks Our Experts Predict Could Double In the Next Year
By submitting your email, you'll also get a free pivot & flow membership. A free daily market overview. You can unsubscribe at any time.