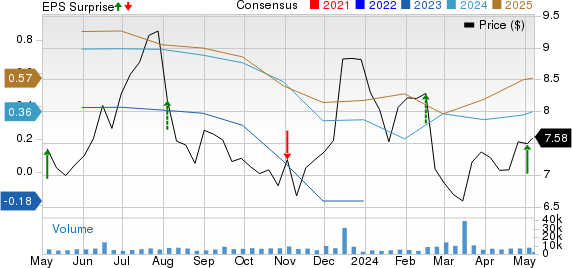
American Axle & Manufacturing Holdings AXL reported first-quarter 2024 adjusted earnings of 18 cents per share, which surpassed the Zacks Consensus Estimate of 1 cent. The company had incurred a loss per share of a penny in the year-ago quarter.
The company generated quarterly revenues of $1.61 billion, outpacing the Zacks Consensus Estimate of $1.51 billion. Revenues increased 8% on a year-over-year basis.
American Axle & Manufacturing Holdings, Inc. Price, Consensus and EPS Surprise
American Axle & Manufacturing Holdings, Inc. price-consensus-eps-surprise-chart | American Axle & Manufacturing Holdings, Inc. Quote
Segmental Performance
In the reported quarter, the Driveline segment recorded sales of $1.11 billion, up 9% year over year. The figure also surpassed our estimate of $1.05 billion. The segment registered adjusted EBITDA of $157.4 million, which increased 37.9% on a year-over-year basis and outpaced our estimate of $137 million.
The company’s Metal Forming business generated revenues of $644.1 million, which rose 4% from the year-ago quarter’s figure and beat our estimate of $591.1 million. The segment registered an adjusted EBITDA of $48.2 million, which declined 21.4% but outpaced our estimate of $33.5 million.
Financial Position
American Axle’s first-quarter SG&A expenses totaled $98.3 million, which remained unchanged from the year-ago quarter’s reported figure.
Net cash provided by operating activities was $17.8 million, down from $32.1 million in the year-ago period.
Capital spending in the quarter was $44.9 million, down from $46.2 million reported in the year-ago period.
In the three months ended Mar 31, 2024, the company posted a negative adjusted free cash flow of $21.4 million compared with a negative $17.1 million recorded in the year-ago period.
As of Mar 31, 2024, American Axle had cash and cash equivalents of $469.8 million compared with $519.9 million as of Dec 31, 2023.
Its net long-term debt was $2.74 billion, down from $2.75 billion as of Dec 31, 2023.
2024 Outlook
American Axle envisions revenues in the range of $6.05-$6.35 billion. The company reported revenues of $6.08 billion in 2023.
Adjusted EBITDA is estimated in the band of $685-$750 million. AXL’s adjusted EBITDA was $693.3 million in 2023.
Adjusted free cash flow is expected in the range of $200-$240 million. The company reported an adjusted free cash flow of $219 million in 2023.
Zacks Rank & Other Key Picks
AXL currently carries a Zacks Rank #2 (Buy).
Some other top-ranked players in the auto space are Geely Automobile Holdings Limited GELYY, Volvo VLVLY and Canoo Inc. GOEV, each sporting a Zacks Rank #1 (Strong Buy) at present. You can see the complete list of today’s Zacks #1 Rank stocks here.
The Zacks Consensus Estimate for GELYY’s 2024 sales suggests year-over-year growth of 36.6%. The EPS estimates for 2024 and 2025 have moved up 34 cents and 54 cents, respectively, in the past 60 days.
The Zacks Consensus Estimate for VLVLY’s 2024 earnings suggests year-over-year growth of 0.43%. The EPS estimates for 2024 and 2025 have improved 5 cents and 11 cents, respectively, in the past 30 days.
The Zacks Consensus Estimate for GOEV’s 2024 sales and earnings suggests year-over-year growth of 7,722.3% and 68.24%, respectively. The EPS estimates for 2024 and 2025 have improved $4.27 and $4.71, respectively, in the past 60 days.
Top 5 Dividend Stocks for Your Retirement
Zacks targets 5 well-established companies with solid fundamentals and a history of raising dividends. More importantly, they have the resources and will to likely pay them in the future.
Click now for a Special Report packed with unconventional wisdom and insights you simply won’t get from your neighborhood financial planner.
See our Top 5 now – the report is FREE >>
American Axle & Manufacturing Holdings, Inc. (AXL) : Free Stock Analysis Report
Geely Automobile Holdings Ltd. (GELYY) : Free Stock Analysis Report
AB Volvo (VLVLY) : Free Stock Analysis Report
Canoo Inc. (GOEV) : Free Stock Analysis Report
To read this article on Zacks.com click here.
The views and opinions expressed herein are the views and opinions of the author and do not necessarily reflect those of Nasdaq, Inc.


