
Analysts See Growth Ahead for Fidelity Enhanced Large Cap Value ETF
At ETF Channel, we’ve evaluated the underlying holdings of various ETFs, including the Fidelity Enhanced Large Cap Value ETF (Symbol: FELV). By comparing each holding’s trading price to the average analyst’s 12-month forward target price, we’ve calculated a weighted average implied target price for the ETF itself, which stands at $35.69 per unit.
Current Price and Upside Potential
FELV is currently trading at approximately $32.04 per unit, indicating an 11.39% potential upside when considering analysts’ average targets for the ETF’s holdings. Notably, three significant holdings have marked upside potential: Brixmor Property Group Inc (Symbol: BRX), Workday Inc (Symbol: WDAY), and MSCI Inc (Symbol: MSCI). BRX trades around $26.46 per share while the average target from analysts is $31.34, showing an upside of 18.44%. Meanwhile, WDAY has a trading price of $260.07, with an average target of $295.59, suggesting a 13.66% rise. Finally, MSCI, currently priced at $590.73, has an average target of $666.73, representing a 12.87% increase.
Performance Comparison
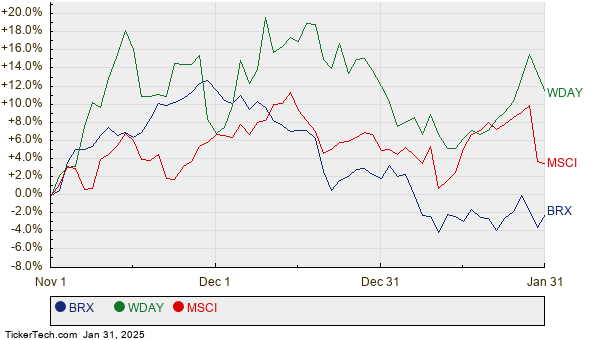
Below is a chart that illustrates the twelve-month price history of BRX, WDAY, and MSCI:

Summary Table of Analyst Targets
| Name | Symbol | Recent Price | Avg. Analyst 12-Mo. Target | % Upside to Target |
|---|---|---|---|---|
| Fidelity Enhanced Large Cap Value ETF | FELV | $32.04 | $35.69 | 11.39% |
| Brixmor Property Group Inc | BRX | $26.46 | $31.34 | 18.44% |
| Workday Inc | WDAY | $260.07 | $295.59 | 13.66% |
| MSCI Inc | MSCI | $590.73 | $666.73 | 12.87% |
Considerations for Investors
Investors may wonder whether analysts’ targets are realistic or overly optimistic. The high targets relative to current trading prices could signal confidence in stock growth, yet they might also lead to potential downgrades if these forecasts are based on outdated information. Further research is essential for investors to evaluate these targets critically.
![]()
![]() 10 ETFs With Most Upside To Analyst Targets »
10 ETFs With Most Upside To Analyst Targets »
Also see:
• OR market cap history
• Institutional Holders of SDOW
• BALL Dividend Growth Rate
The views and opinions expressed herein are those of the author and do not necessarily reflect those of Nasdaq, Inc.


