Harley-Davidson Faces Challenges Ahead of Upcoming Earnings Report
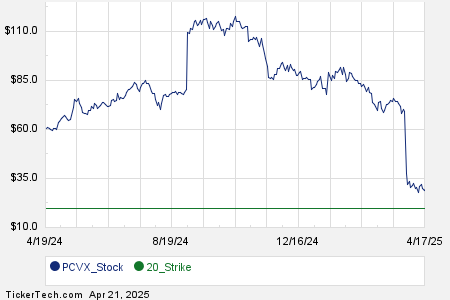
Harley-Davidson (NYSE:HOG) is expected to report its upcoming earnings in the next few weeks. The well-known motorcycle manufacturer has encountered difficulties in recent quarters, primarily impacted by the current high-interest-rate environment that has dampened consumer confidence. The challenges may continue into Q1, as motorcycle sales in the U.S. remain stagnant. According to MotorCycles Data, total motorbike sales in February decreased by 20.7% compared to the same period last year. Furthermore, uncertainty stemming from President Donald Trump’s tariffs on over 100 countries has exacerbated the weak consumer climate. Analysts estimate revenues to be around $1.11 billion, with earnings projected at $0.78 per share, a significant decline from $1.72 in the same quarter last year.
Year-to-date, Harley stock has dropped more than 25%. The company currently holds a market capitalization of $2.7 billion and reported revenue of $5.2 billion over the last twelve months. Harley-Davidson remained operationally profitable, posting $417 million in operating profits and a net income of $455 million. For those seeking investment opportunities with less volatility than individual stocks, the Trefis High-Quality portfolio offers an alternative, having outperformed the S&P 500 with returns exceeding 91% since its inception.
See earnings reaction history of all stocks
Harley-Davidson’s Odds of Positive Post-Earnings Returns
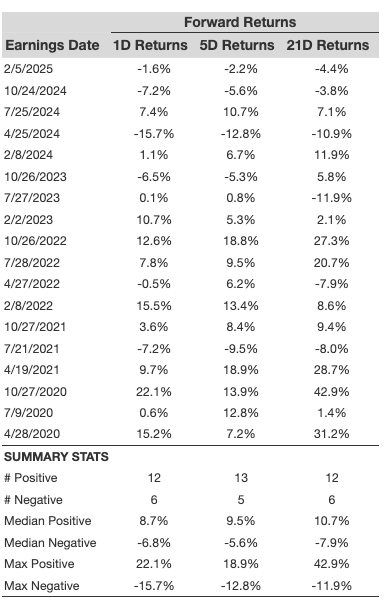
Examining Harley-Davidson’s historical earnings performance reveals some insights about one-day (1D) post-earnings returns:
- Over the past five years, there have been 18 recorded earnings data points, with 12 positive and 6 negative one-day (1D) returns. This indicates a 67% positive return rate.
- However, narrowing the focus to the last three years reduces this percentage to 55%.
- The median of the 12 positive returns is 8.7%, while the median of the 6 negative returns is -6.8%.
Additional data on 5-Day (5D) and 21-Day (21D) returns after earnings, along with relevant statistics, is summarized in the accompanying table below.

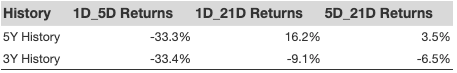
Analyzing Correlation Between Earnings Returns
Exploring potential strategies to mitigate risk involves understanding the correlation between short-term and medium-term returns post-earnings. Finding pairs with the highest correlation can guide trades. For example, if the correlation between 1D and 5D returns is strong, traders could take a “long” position for the next five days following a positive 1D return. Data regarding correlations based on a five-year and three-year history can be useful for making informed trading decisions.
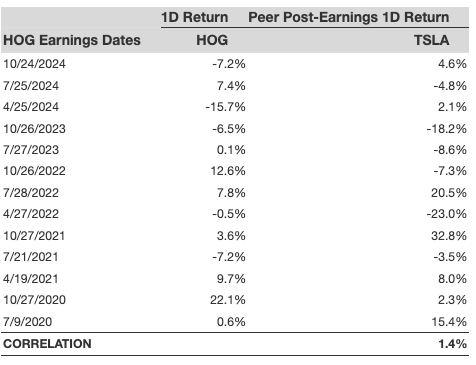
Impact of Peer Earnings on Stock Reactions
Performance of peer companies can significantly influence Harley-Davidson’s post-earnings stock reaction. Often, pricing may begin before earnings are released. Historical data compares Harley-Davidson’s post-earnings performance with peers that reported earnings shortly before Harley-Davidson. This fair comparison incorporates their post-earnings one-day (1D) returns as well.
Consider exploring the Trefis RV strategy, which has consistently outperformed its all-cap stocks benchmark, combining S&P 500, S&P mid-cap, and Russell 2000 for strong investor returns. If you’re interested in a smoother investment experience compared to an individual stock like Harley-Davidson, consider the High-Quality portfolio that has also outperformed the S&P, generating over 91% returns since its inception.
Invest with Trefis Market-Beating Portfolios
See all Trefis Price Estimates
The views and opinions expressed herein are those of the author and do not necessarily reflect the views of Nasdaq, Inc.