Live Nation Shares Stall Following Significant Drop
Trading in shares of Live Nation Entertainment, Inc. LYV has been muted on Wednesday after a steep sell-off of 6.5% the previous day. This decline raises questions about the stock’s potential direction moving forward.
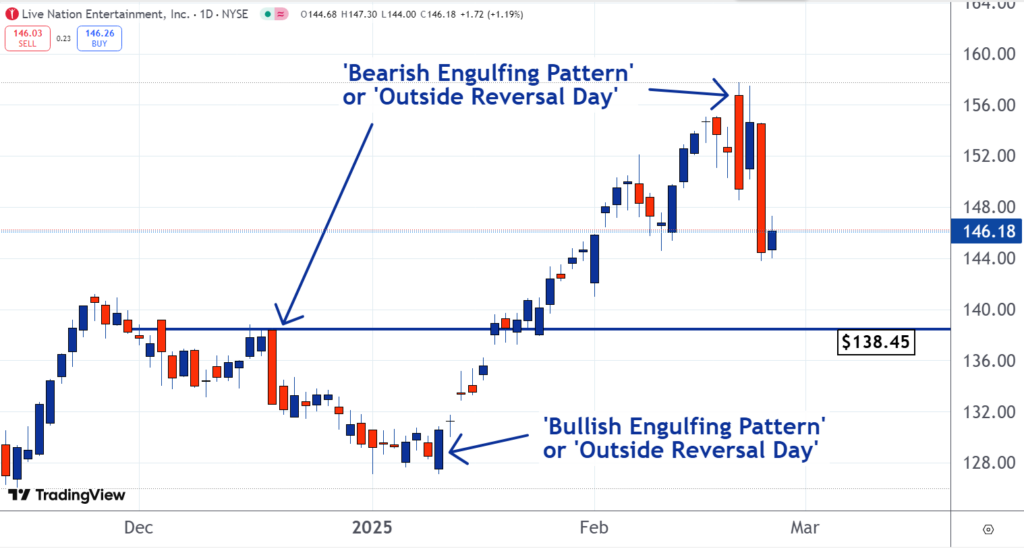
Potential Support Levels and Analyst Insights
There is a possibility that the stock will continue to slide. Should this occur, technical analysts suggest that support may form around $138.45, establishing a potential floor for the stock. Therefore, our analysts have designated it as our Stock of the Day.
Historical Resistance and Market Reactions
As illustrated on the chart, the $138.45 level served as a resistance point back in December. Following that resistance, many traders who sold shares likely felt justified in their decisions. However, as the stock broke through this point and rose higher, some sellers found themselves regretting their actions.
These traders often look to re-enter the market at their original sell price, which suggests that should the stock return to this level, remorseful sellers may place buy orders. If their numbers are sufficient, this could result in the emergence of support at a previously established resistance level.

Market Movements and Bulls’ Outlook
If bullish sentiment prevails, the stock could recover. A notable example occurred on January 13, when the stock opened lower but reversed course by the close. The trading session that day resulted in a bullish engulfing pattern, marked by a closing price higher than the previous day’s opening, illustrating a shift from bearish to bullish momentum.
In contrast, the recent downturn can be traced back to a bearish engulfing pattern observed previously. On February 21, the stock opened higher only to be overwhelmed by selling pressure, closing below the previous open—a clear bearish signal.
Understanding Market Leadership Changes
Market leadership transitions can occur over both short and extended periods. Often, when such changes happen quickly, they manifest as “engulfing” patterns in the price charts. This phenomenon serves as a reminder that market dynamics can shift abruptly, influencing trader sentiment and stock performance.
Read Next:
• Man Who Lost $775 Million Bitcoin Hard Drive Faces New Setback: Recovery Chances Are 1 In 902 Million, Waste Expert Claims
Photo: Shutterstock
Market News and Data brought to you by Benzinga APIs