Ansys Inc. Shares Drop Below 200-Day Moving Average
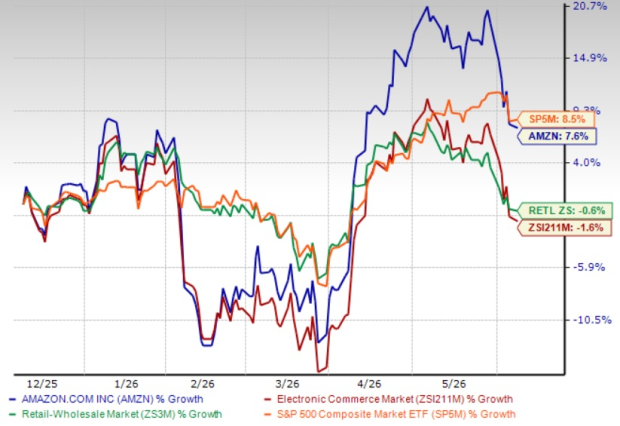
On Wednesday, Ansys Inc. (Symbol: ANSS) shares fell below their 200-day moving average of $329.40, trading as low as $326.17. Currently, Ansys shares are down approximately 6.2% for the day. The chart below illustrates the one-year performance of ANSS shares compared to the 200-day moving average:

Within the last 52 weeks, ANSS’s share price has reached a low of $275.06 and a high of $363.03, with the most recent trade occurring at $329.93. The DMA information is sourced from TechnicalAnalysisChannel.
![]()
![]() For insights on more stocks that recently fell below their 200-day moving average, click here.
For insights on more stocks that recently fell below their 200-day moving average, click here.
Related Topics:
- Airlines Dividend Stocks
- Institutional Holders of EVDY
- KAI Price Target
The views and opinions expressed herein are the views and opinions of the author and do not necessarily reflect those of Nasdaq, Inc.
5 Stocks Our Experts Predict Could Double In the Next Year
By submitting your email, you'll also get a free pivot & flow membership. A free daily market overview. You can unsubscribe at any time.