Badger Meter Earnings Report Expected: Key Insights for Traders
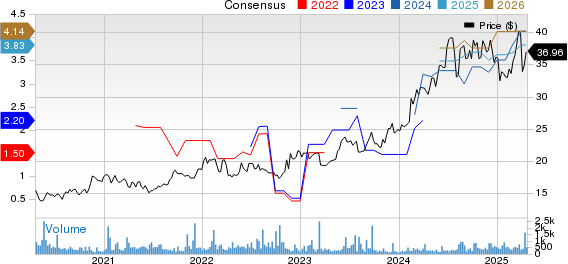
Badger Meter Stock (NYSE: BMI) stands as the leading water management solutions provider in North America. The company specializes in flow measurement, water quality monitoring, pressure analysis, and analytics software that utilizes its valuable data. Badger Meter is scheduled to report its fiscal first-quarter earnings on Thursday, April 17, 2025. Analysts forecast earnings of $1.05 per share, corresponding to sales of $220.7 million. This projection signifies a 12% increase in earnings and a 6% rise in sales compared to last year’s reported figures of $0.99 per share and $196.3 million, respectively. Historically, Badger Meter’s stock has increased post-earnings around 60% of the time, with an average one-day gain of 7.3% and a peak growth of 17%.
Currently, Badger Meter holds a market capitalization of $5.4 billion. Over the past twelve months, the company generated $827 million in revenue, yielding $158 million in operating profits and $125 million in net income. Investors should note that outcomes will heavily depend on the company’s performance relative to expectations. For event-driven traders, awareness of historical trends can potentially enhance trading strategies.
Event-Driven Trading Insights
For traders focused on event-driven strategies, historical performance data can provide valuable insights when deciding to act before or after earnings releases. If you prefer less volatility compared to individual stocks, the Trefis High-Quality portfolio could be a sound alternative. This portfolio has outperformed the S&P 500, yielding over 91% in returns since its inception. Explore the earnings reaction history for all stocks here.

Image by Fernando50 from Pixabay
Badger Meter’s Historical Post-Earnings Returns
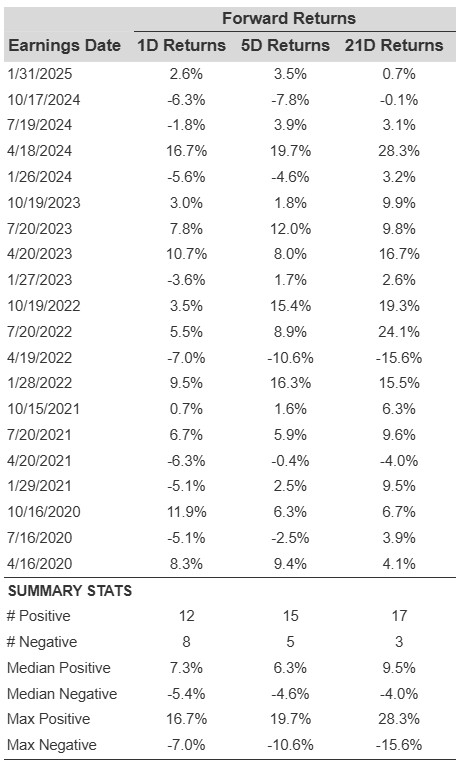
Reviewing the data on one-day (1D) post-earnings returns reveals the following:
- In the last five years, there have been 20 documented earnings events, resulting in 12 positive and 8 negative one-day returns. This indicates a positive return rate of approximately 60%.
- Notably, this percentage drops to 58% when analyzing just the last three years.
- The median positive return was 7.3%, while the median for negative returns was -5.4%.
Further data on 5-day (5D) and 21-day (21D) post-earnings performance is available in the table below for comprehensive insights.
Understanding Correlation in Historical Returns
Utilizing correlations between short-term and medium-term returns can offer a less risky trading strategy, provided the correlation is substantial. Investors can examine pairs with strong correlations, such as between 1D and 5D returns, to inform their trading decisions. If the 1D return post-earnings is positive, a trader might consider taking a long position for the subsequent five days. Correlation data based on five years and three years of historical performance is available for review. Notably, the designation 1D_5D examines the correlation between 1D post-earnings returns and the ensuing 5D returns.

BMI Correlation Between 1D, 5D, and 21D Historical Returns
Discover more about the Trefis RV strategy, which has historically outperformed its all-cap stocks benchmark, combining all three indices: the S&P 500, S&P mid-cap, and the Russell 2000, thus delivering solid returns for investors.
Invest with Trefis Market-Beating Portfolios
Explore all Trefis Price Estimates
The views and opinions expressed herein are those of the author and do not necessarily reflect the views of Nasdaq, Inc.