Ford Earnings Report: A Decline in Profits Expected
Ford Motor (NYSE:F) is scheduled to report its earnings on May 5, 2025. Analysts forecast earnings of approximately $0.01 per share, a significant drop from $0.49 per share from the same quarter last year. Revenue projections estimate around $35.3 billion, which represents an 11.6% decline year-over-year. In the first quarter, Ford released its vehicle delivery figures for the U.S., showing a 1.3% decrease compared to the previous year. This decline is attributed to the discontinuation of certain models along with the timing of specific rental fleet sales. Conversely, GM, Ford’s main competitor, reported a 17% year-over-year increase in U.S. sales in Q1 2025. However, Ford’s pickup truck sales—including the Maverick, Ranger, and F-Series—saw a 25% increase, potentially mitigating some negative effects on margins and profitability.
Currently, Ford holds a market capitalization of $38 billion. Over the past twelve months, the company generated revenues of $185 billion and achieved operational profitability, recording $5.2 billion in operating profits and net income of $5.9 billion. For investors seeking lower volatility alternatives, the Trefis High-Quality portfolio may be a viable option, having outperformed the S&P 500 with returns exceeding 91% since its inception.
See earnings reaction history of all stocks
Ford Motor’s Historical Post-Earnings Trends
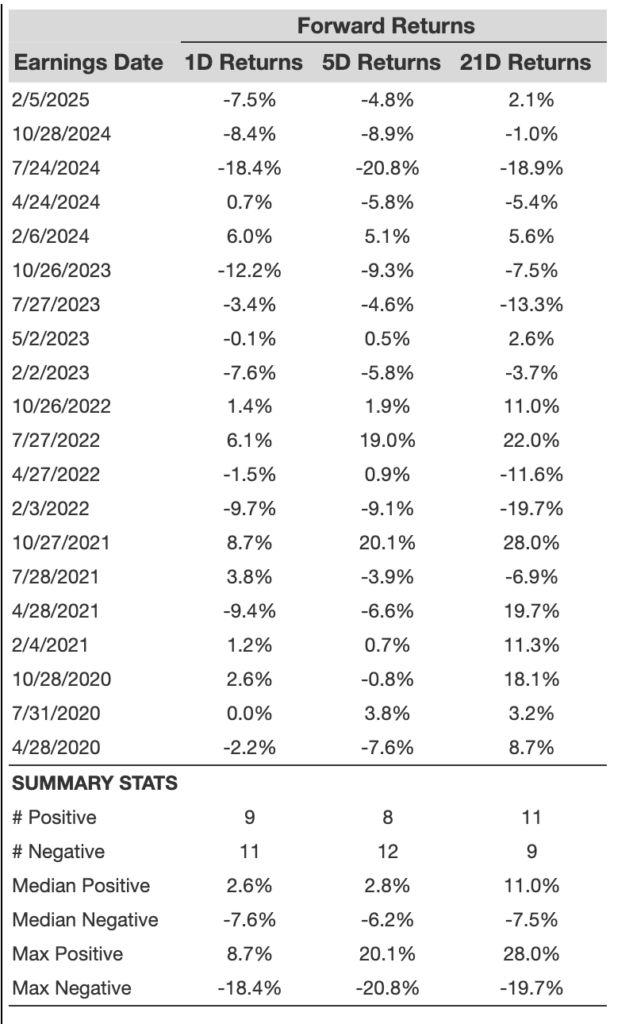
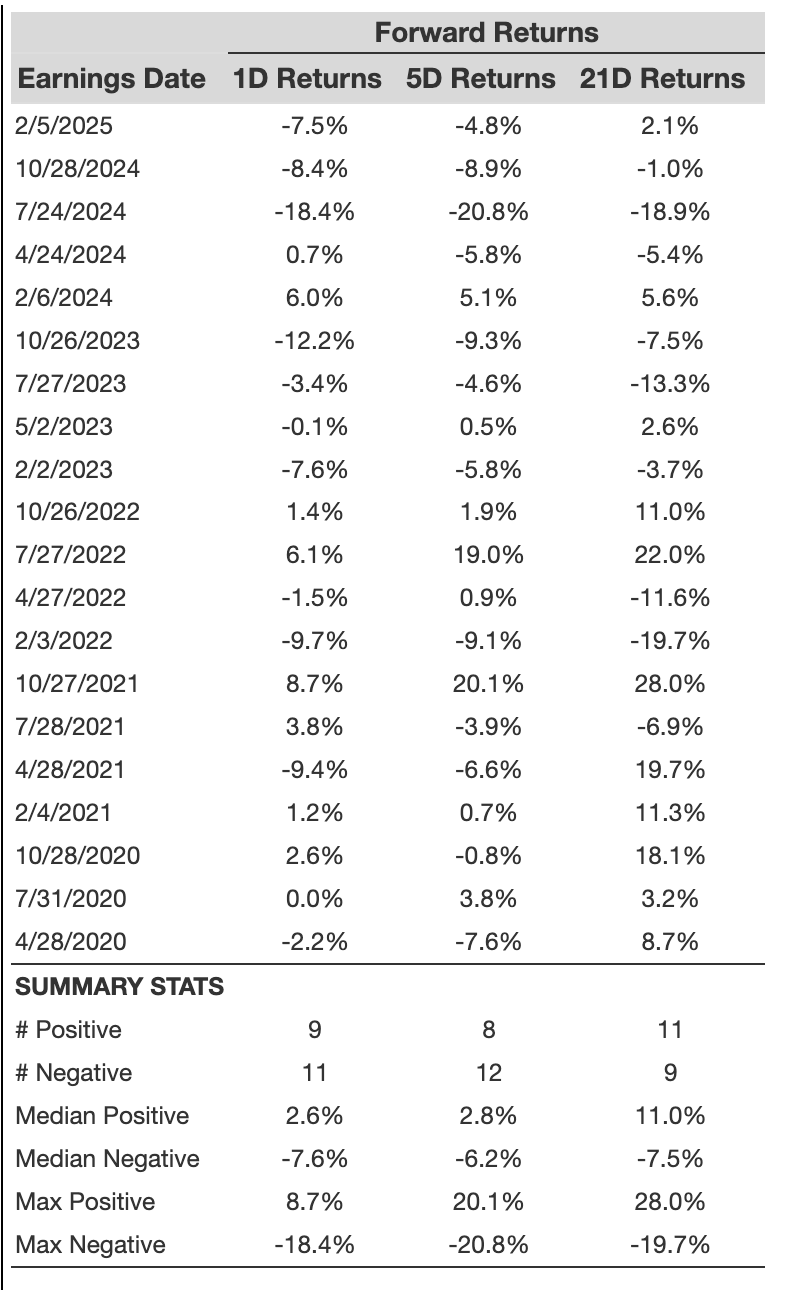
Here are some insights on one-day (1D) post-earnings returns:
- Over the past five years, Ford recorded a total of 20 earnings data points, resulting in 9 positive and 11 negative one-day returns. This indicates that positive 1D returns occurred approximately 45% of the time.
- However, this percentage decreases to 33% when analyzing data from the last three years.
- The median return for the 9 positive instances was 2.6%, whereas the median for the 11 negative returns was -7.6%.
Additional information regarding 5-day (5D) and 21-day (21D) returns post-earnings is summarized in the table below.
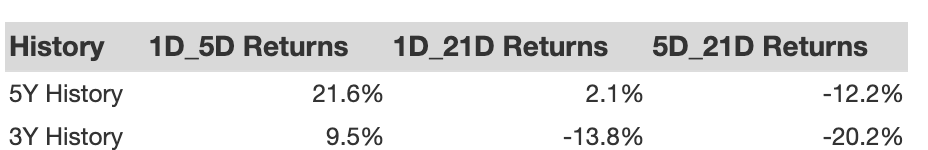
Understanding Return Correlations
To mitigate risk, traders may benefit from examining the correlation between short-term and medium-term returns after earnings. Finding correlations that are strong can lead to more informed trading decisions. For instance, if there is a high correlation between 1D and 5D returns, a positive 1D post-earnings result could prompt traders to go long for the following five days. The following correlation data reflects both a 5-year and a more recent 3-year history. Note that the correlation 1D_5D refers to the relationship between 1D post-earnings returns and the subsequent 5D returns.
The views and opinions expressed herein are solely those of the author and do not necessarily reflect those of Nasdaq, Inc.