General Motors Earnings Release: Insights and Projections for Investors
General Motors (NYSE:GM) will report earnings on Tuesday, April 29, 2025. Consensus estimates project earnings of $2.65 per share on revenue of $43 billion, which remains roughly consistent with the previous year. However, there is potential for better-than-expected results. Many customers likely increased their vehicle purchases in March, in anticipation of possible impacts from President Trump’s proposed automotive import tariffs. Notably, GM enjoyed a 17% year-over-year increase in U.S. sales for Q1 2025, outperforming several major competitors. Growth stemmed from strong demand for full-sized SUVs and a rise in electric vehicle (EV) sales, which have started to capture market share from rivals like Tesla.
The outlook for GM will be closely scrutinized, particularly in light of possible tariff impacts. More than 50% of GM vehicles sold in the U.S. are produced domestically, which positions the company vulnerably regarding potential cost increases associated with imports and foreign-manufactured parts used in U.S. assembly.
Currently, GM has a market capitalization of $47 billion. Over the past twelve months, the company reported $187 billion in revenue, achieving operational profitability with $13 billion in operating profits and a net income of $6 billion. For investors seeking upside with less volatility than individual stocks, the Trefis High-Quality Portfolio may offer an intriguing alternative, having outpaced the S&P 500 with returns exceeding 91% since its inception.
See earnings reaction history of all stocks
General Motors’ Historical Post-Earnings Returns
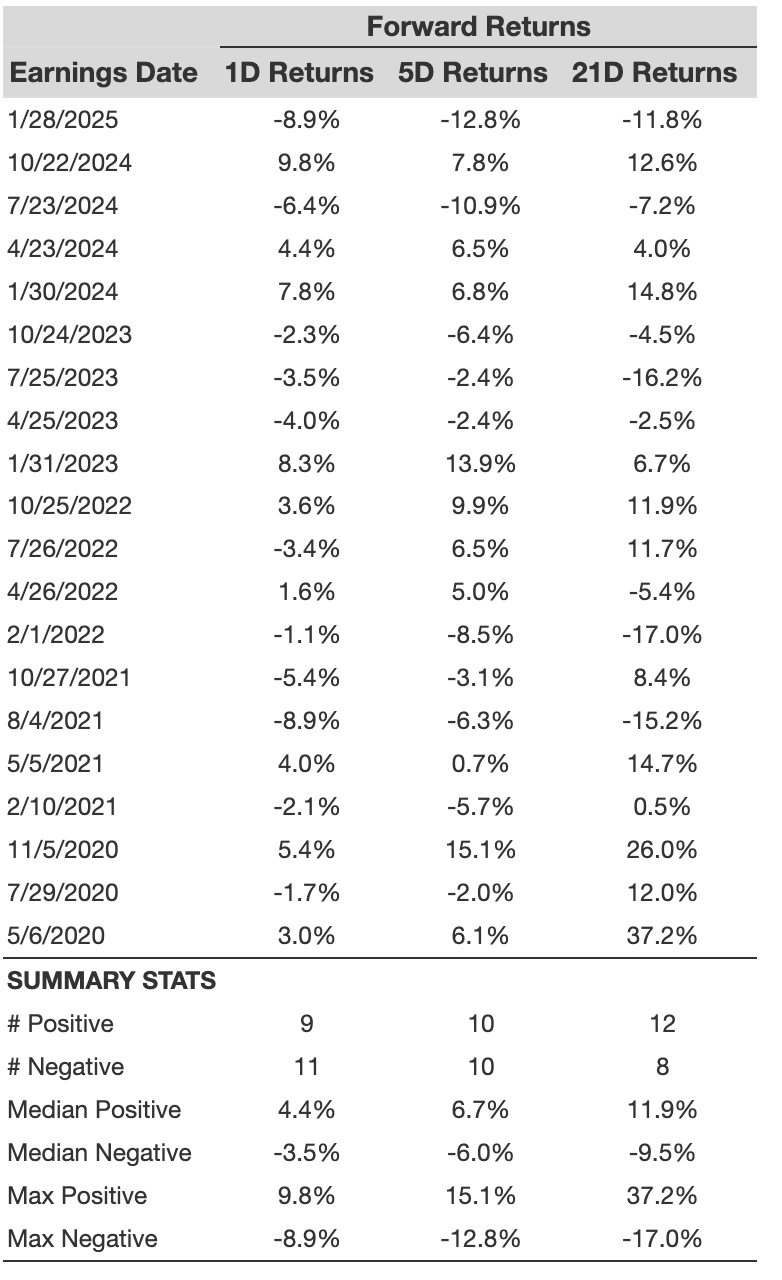
Viewing the last five years, here are some key statistics on one-day (1D) post-earnings returns:
- Out of 20 recorded earnings events, GM noted 9 positive and 11 negative one-day returns, indicating that positive returns occurred approximately 45% of the time.
- This percentage improves to 50% when analyzing the last three years alone.
- The median for the 9 positive returns stood at 4.4%, while the median for the 11 negative returns was -3.5%.
Further performance insights for observed 5-Day (5D) and 21-Day (21D) returns post-earnings are summarized in the table below.

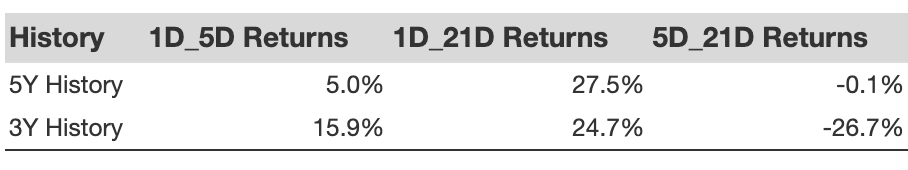
A less risky approach focuses on understanding correlations between short-term and medium-term returns following earnings. Finding pairs with strong correlations allows traders to strategize accordingly. For instance, if 1D and 5D returns show high correlation, a trader might opt to take a “long” position if the 1D return is positive. Correlation data based on both 5-year and 3-year histories is available, with 1D_5D indicating the correlation between one-day post-earnings returns and subsequent five-day returns.
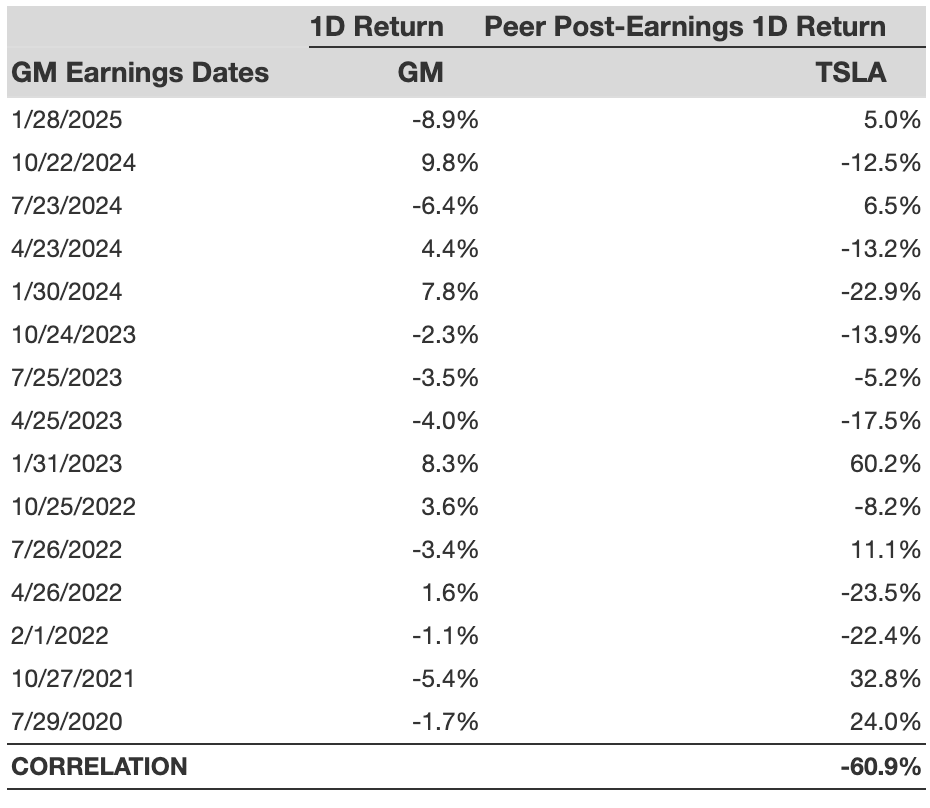
Correlation With Peer Company Earnings
Peer performance may also influence post-earnings reactions. Often, market pricing can shift even before earnings announcements occur. Here, some historical data compares GM’s post-earnings stock performance with that of peers who reported earnings shortly beforehand. The peer stock returns represent one-day (1D) post-earnings returns for fair analysis.
For those interested in an investing strategy that has performed well against an all-cap stocks benchmark, learn more about the Trefis RV strategy. Additionally, the High-Quality Portfolio could provide smoother returns compared to individual stocks like General Motors while still outperforming the S&P 500 with returns exceeding 91% since launch.
Invest with TrefisStock-to-reach-60-EndLinks”>Market Beating Portfolios
See all TrefisStock-to-reach-60-EndLinks”>Price Estimates
The views and opinions expressed herein are the views and opinions of the author and do not necessarily reflect those of Nasdaq, Inc.