
New York Times Earnings Forecast for Q1 2025 Shows Strong Growth Potential
The New York Times Company (NYSE: NYT) is set to announce its fiscal first-quarter earnings on Wednesday, May 7, 2025. Analysts anticipate earnings of 34 cents per share on $635 million in revenue. This projection marks a 42% increase in earnings year-over-year and a 7% rise in sales from the previous year’s figures of 24 cents per share and $594 million in revenue. Traditionally, the NY Times stock tends to perform well following earnings announcements, with a history of increasing 60% of the time, a median one-day rise of 3.9%, and a peak increase of 12%.
Revenue Growth and Cost Expectations
Looking to Q1 2025, the NY Times forecasts a year-over-year growth of 14% to 17% in digital-only subscription revenue, with a mid-single-digit increase in other revenue avenues. Adjusted operating costs are projected to rise by 5% to 6%, largely due to planned investments in technology and content development. The company’s legal stance regarding intellectual property, alongside ongoing technological initiatives, plays a pivotal role in maintaining competitive advantage and subscriber engagement. Presently, NY Times boasts a market capitalization of $8.5 billion. Over the last twelve months, it reported $2.6 billion in revenue, $351 million in operating profit, and $294 million in net income.
Market Trends and Trading Strategies
Event-driven traders often leverage historical patterns to inform their strategies, whether positioning ahead of earnings announcements or reacting post-release. Although individual stocks can be volatile, alternatives like the Trefis High Quality portfolio have outperformed the S&P 500, generating returns above 91% since inception.

Photo by Andrys on Pixabay
Analyzing Historical Earnings Returns
The NY Times has recorded 20 earnings data points over the past five years, with 12 positive and 8 negative one-day returns. This indicates that positive returns occur approximately 60% of the time. However, this figure drops to 58% when focusing solely on the last three years. The average of the 12 positive returns is 3.9%, while the average for the 8 negative returns is -7.5%.
Understanding 1D, 5D, and 21D Returns
Investors seeking a less risky approach may consider the correlation between short-term and medium-term returns following earnings announcements. A strategy could involve executing trades based on the strongest correlations. For example, if there is a strong link between one-day and five-day returns, a trader might take a long position if the one-day post-earnings return is favorable. This strategy is depicted through correlation data from different timeframes.
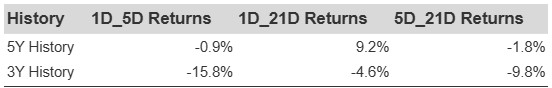
NY Times Correlation Between 1D, 5D, and 21D Historical Returns
The views and opinions expressed herein are the views and opinions of the author and do not necessarily reflect those of Nasdaq, Inc.