Roku Anticipates Q1 2025 Earnings Amidst Subscriber Growth
Roku (NASDAQ: ROKU) is preparing to report its Q1 2025 earnings on May 1. Analysts predict that the company will continue to experience growth due to an increasing user base and rising advertising revenues. According to consensus estimates, Roku’s revenues are expected to rise by approximately 14% year-over-year, reaching $1.01 billion. Losses are projected to be around -$0.25 per share, reflecting a slight improvement from the previous year.
As of early January, Roku had 90 million subscribers, marking a year-over-year growth of roughly 12.5%. This expansion is likely to enhance the company’s platform business, which generates revenue from digital video subscriptions and advertisements on Roku devices. Additionally, stronger engagement metrics may help boost advertising sales; in Q4, total streaming hours reached 34 billion, an 18% increase compared to the same quarter last year.
Roku currently has a market capitalization of $8.5 billion. Over the last twelve months, its revenue stood at $4.1 billion. However, the company reported operational losses totaling $218 million, with a net loss of $129 million. For investors seeking lower volatility than individual stocks, the Trefis High-Quality Portfolio may provide an alternative, having outperformed the S&P 500 with returns over 91% since its inception.
Roku’s Historical Odds of Positive Post-Earnings Returns
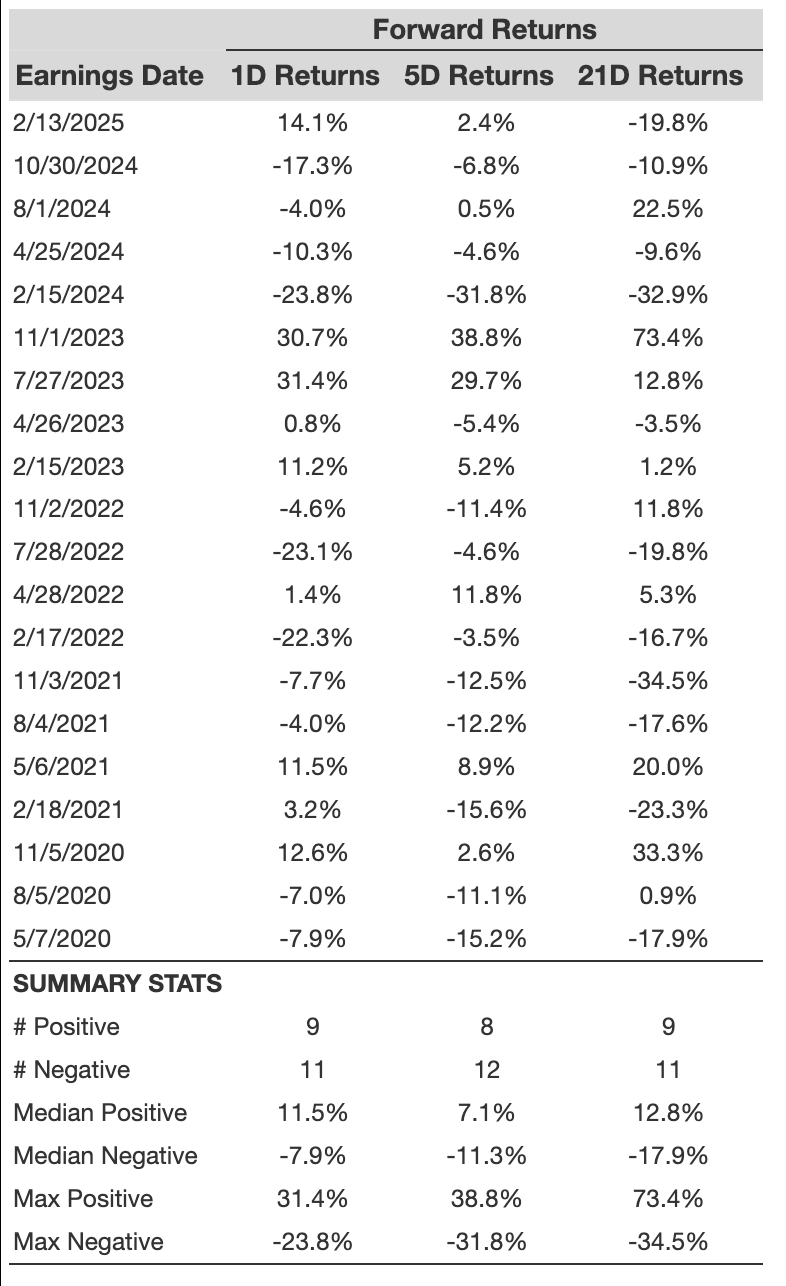
Examining Roku’s one-day post-earnings returns reveals important trends:
- Out of 20 earnings data points over the past five years, there were 9 positive and 11 negative one-day returns. Therefore, positive returns occurred approximately 45% of the time.
- Considering only the last three years raises this percentage to 50%.
- The median of the 9 positive returns was 12%, while the median of the 11 negative returns was -7.9%.
Additional statistics for observed 5-day (5D) and 21-day (21D) returns following earnings announcements are summarized in the table below.
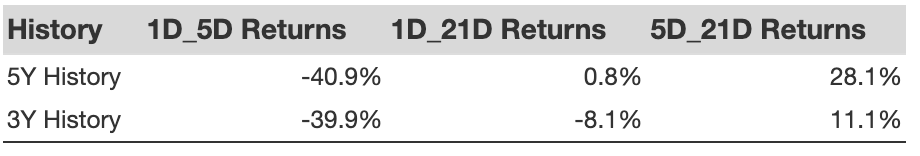
Correlation Between 1D, 5D, and 21D Historical Returns
Understanding the correlation between short-term and medium-term returns post-earnings can guide trading strategies. For example, if the one-day (1D) return demonstrates a positive correlation with the five-day (5D) return, a trader might decide to hold a long position for the subsequent five days. The following correlation data is based on both five-year and three-year historical trends, specifically noting how 1D returns correlate to subsequent 5D returns.
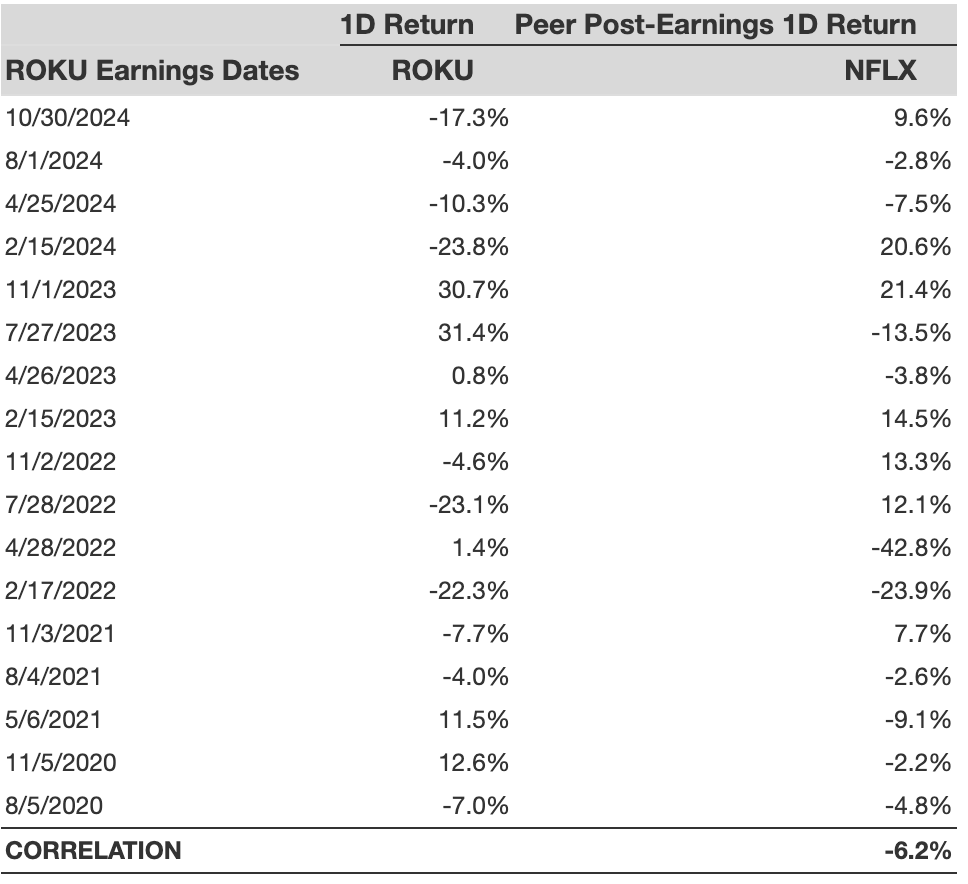
Is There Any Correlation With Peer Earnings?
The performance of peers can sometimes influence Roku’s post-earnings stock reactions. Market pricing may adjust before earnings announcements. The following historical data compares Roku’s post-earnings stock performance with that of peers who reported earnings immediately before Roku. For fairness, peer stock returns also represent post-earnings one-day (1D) returns.
The views and opinions expressed herein are those of the author and do not necessarily reflect those of Nasdaq, Inc.