
Snowflake Forecasts 21% Revenue Growth as Q1 Earnings Approach
Cloud data warehousing leader Snowflake (NYSE:SNOW) is set to report its Q1 FY’26 earnings on May 21, covering the quarter ending in April 2025. Analysts expect the company to continue profiting from its initiatives to incorporate artificial intelligence (AI) tools for customers. Revenue is projected to increase 21% year-over-year, reaching approximately $1 billion, while adjusted earnings are estimated to be $0.21 per share, reflecting a 50% rise from the previous year. Snowflake has been enhancing its AI portfolio through strategic initiatives, such as a multiyear partnership with Anthropic and the acquisition of AI startup Datavolo. By integrating these AI capabilities into its core data warehousing platform, Snowflake aims to simplify the process for customers to build and run AI applications without the burden of migrating data. This streamlined approach could save time and reduce complexity for users. The company has guided its product revenues to range from $955 million to $961 million for the quarter.
Currently, Snowflake boasts a market capitalization of $61 billion. Over the past twelve months, the company recorded revenue of $3.6 billion but also reported operational losses of $1.5 billion and a net income of negative $1.3 billion. For investors seeking lower volatility, alternatives like the Trefis High Quality portfolio, which has outperformed the S&P 500 with returns exceeding 91% since inception, may be appealing.
Snowflake’s Historical Odds of Positive Post-Earnings Return
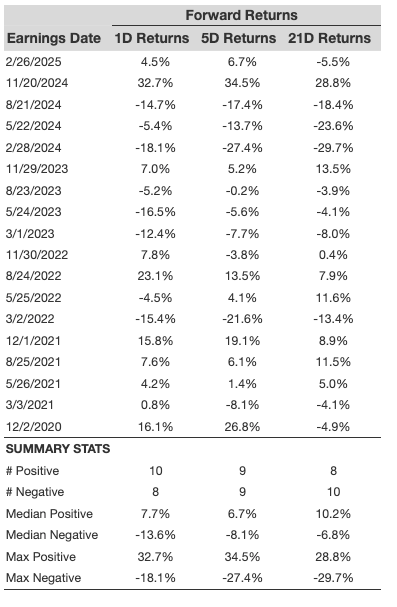
Several observations from past performance on one-day (1D) post-earnings returns include:
- In the last five years, Snowflake had 18 recorded earnings data points with 10 positive and 8 negative one-day returns, resulting in positive returns approximately 56% of the time.
- This percentage drops to 42% when considering the last three years instead of five.
- The median of positive returns was 7.7%, while the median of negative returns was -14%.
Additional statistics for observed 5-day (5D) and 21-day (21D) returns post-earnings are detailed in the table below.

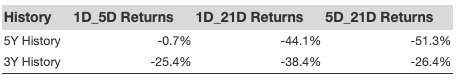
Correlation Between 1D, 5D, and 21D Historical Returns
A less risky trading strategy involves examining the correlation between short-term and medium-term returns post-earnings. If there is a high correlation, traders may position themselves “long” for the next 5 days following a positive 1D return. Below is correlation data based on a 5-year and a 3-year history; the correlation 1D_5D refers to the relationship between one-day post-earnings returns and subsequent 5-day returns.
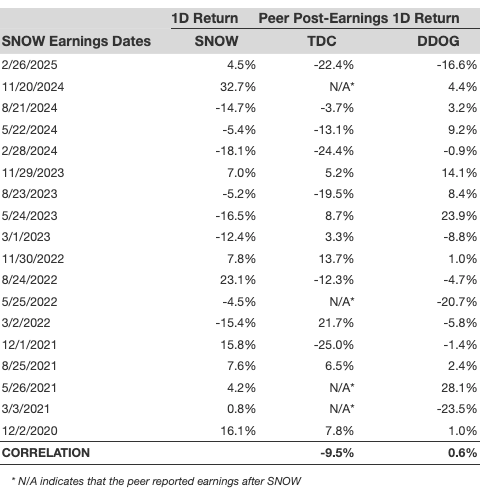
Impact of Peer Earnings on Snowflake’s Stock Reaction
The performance of peers can affect the stock’s reaction after earnings announcements. Often, the pricing adjustments begin prior to the actual earnings report. The following data illustrates the historical post-earnings performance of Snowflake’s stock compared to its peers that reported earnings just before Snowflake.
The views and opinions expressed herein are those of the author and do not necessarily reflect those of Nasdaq, Inc.


