Walmart’s Q1 Earnings Anticipated to Show Modest Revenue Growth
[Note: Walmart’s Fiscal Year 2025 ended on January 31, 2025]
Upcoming Earnings Release
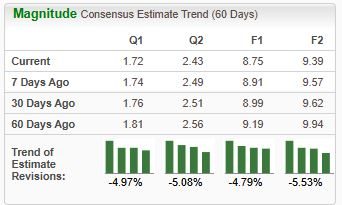
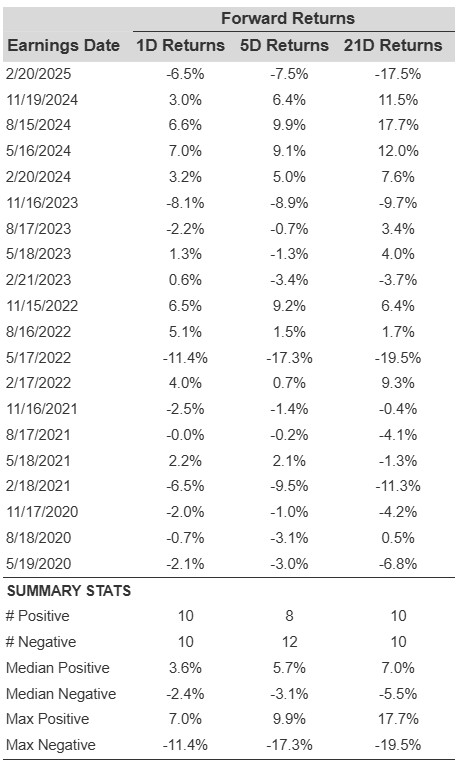
Walmart (NYSE: WMT) is set to unveil its fiscal first-quarter earnings on Thursday, May 15, 2025. Analysts are forecasting earnings of 58 cents per share on $164.47 billion in revenue. This would indicate an 8% decline in earnings year-over-year and a 2% increase in sales compared to the same quarter last year, which reported earnings of 63 cents per share and revenue of $161.51 billion. Historically, Walmart’s stock has risen 50% of the time following earnings announcements, with a median one-day increase of 3.6% and a maximum observed gain of 7%.
Challenges and Financial Health
Walmart’s management has recently pointed out significant challenges posed by ongoing tariffs and the resulting market uncertainty. These factors are making it difficult to maintain profit margins and predict future profitability accurately. Rising costs are expected to pressure the company’s bottom line, reflecting broader trends of sustained inflation and renewed economic volatility affecting consumer spending. Nevertheless, Walmart remains financially strong with a current market capitalization of $774 billion. Over the past year, the retailer generated $681 billion in revenue, achieved $27 billion in operating profit, and a net income of $16 billion.
Historical Performance Insights
For event-driven traders, historical patterns may provide an advantage, whether by positioning before earnings or responding to post-release movements. Consider historical data to understand potential market behavior surrounding earnings announcements.

Photo by Alexas_Fotos on Pixabay
Walmart’s Historical Earnings Returns
Observations regarding one-day (1D) post-earnings returns reveal:
- Over the last five years, there have been 20 recorded earnings events, yielding 10 positive and 10 negative one-day return outcomes. This results in positive returns approximately 50% of the time.
- Notably, the percentage increases to 67% when considering the last three years instead of five.
- The median of the 10 positive returns stands at 3.6%, while the median of the 10 negative returns is -2.4%.
Further data on observed 5-day (5D) and 21-day (21D) returns post-earnings is summarized along with statistics in the table below.
Correlation of Returns Post-Earnings
A relatively lower-risk strategy involves assessing the correlation between short-term and medium-term returns following earnings announcements. Identifying pairs with the highest correlation can enhance trading decisions. For instance, if the one-day and five-day returns exhibit a strong correlation, a trader might opt for a “long” position for the next five days if the one-day post-earnings return is positive.
Analyzing Walmart Earnings Correlations: A Closer Look
The correlation data is based on both 5-year and 3-year historical performance. Specifically, the term 1D_5D refers to the correlation between 1-day post-earnings returns and the subsequent 5-day returns.

WMT Correlation Between 1D, 5D, and 21D Historical Returns
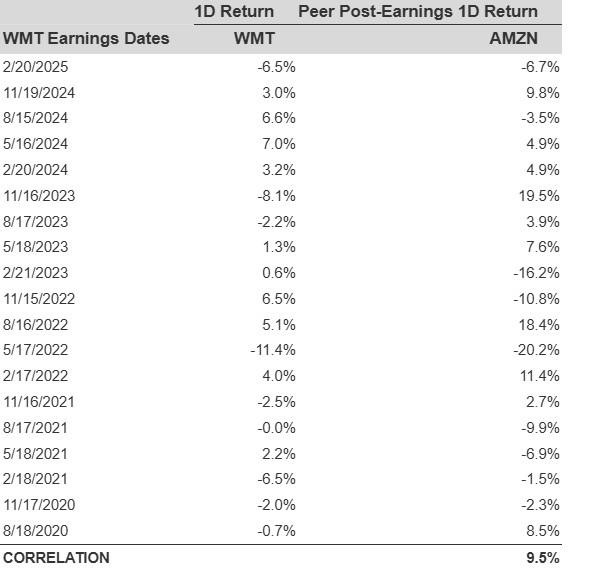
Does Peer Earnings Affect Walmart’s Stock Performance?
Peer performance can significantly influence Walmart’s post-earnings stock reactions. Generally, market adjustments begin well before the earnings reports are released. Below, we present historical data comparing Walmart’s post-earnings performance with that of its peers, which reported earnings just prior to Walmart’s announcement. For a fair assessment, the stock returns of these peers represent their respective post-earnings one-day (1D) returns.
The views and opinions expressed herein are those of the author and do not necessarily reflect those of Nasdaq, Inc.