
Stock Market Experiences Significant Volatility in April
Looking back over a hundred years, stocks have provided the highest average annual return among asset classes. However, this doesn’t shield the Stock market from its share of challenges. Since the S&P 500 (SNPINDEX: ^GSPC) reached its record-closing high on February 19, both the Dow Jones Industrial Average (DJINDICES: ^DJI) and the S&P 500 have slid into correction territory. Additionally, the growth-focused Nasdaq Composite (NASDAQINDEX: ^IXIC) has lost over 20% of its value, marking its first bear market since 2022.

Image source: Getty Images.
Market corrections and bear markets are common in investing cycles. However, the events of April were anything but typical. The S&P 500 marked its fifth-worst two-day decline in 75 years on April 3 and 4. Just days later, on April 9, the Dow, S&P 500, and Nasdaq Composite recorded their largest single-session point increases ever.
April’s Historic Volatility: Key Catalysts
To analyze the data predicting future Stock returns, it’s important to first look at the four factors that contributed to April’s volatility. Many of these issues are likely to persist.
Leading the list were President Donald Trump’s tariff announcements made on April 2, which he termed “Liberation Day.” He proposed a global 10% tariff and raised “reciprocal tariff rates” on several countries that typically run trade deficits with the U.S.
Even with Trump’s 90-day pause on reciprocal tariffs for all countries except China, investor concerns remain high. Worries about retaliatory tariffs, deteriorating trade relations, the potential for anti-American sentiment abroad, and the risk of higher domestic inflation due to input tariffs loom large.

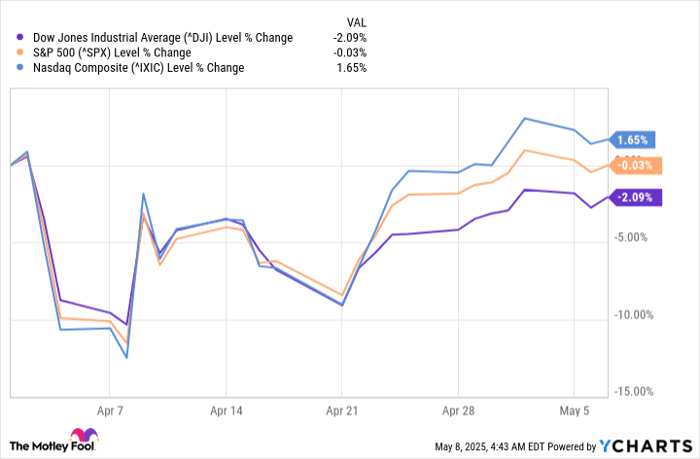
Volatility for the Dow Jones, S&P 500, and Nasdaq Composite has been extreme since the start of April. ^DJI data by YCharts.
Concerns about a U.S. recession also fueled volatility in April. The initial estimate for U.S. gross domestic product (GDP) for the first quarter revealed an annualized contraction of 0.3%. Although better than the Atlanta Fed’s GDPNow model forecast of a 2.5% decline, it marked the first contraction in three years.
Additionally, an expensive Stock market contributed to the fluctuations. In December, the S&P 500’s Shiller Price-to-earnings (P/E) Ratio reached 38.89, marking a peak in the current bull market cycle and standing as the third-highest multiple during a continuous bull cycle over the past 154 years.
Historically, the Shiller P/E has only remained above 30 for at least two months on six occasions in the last 150 years. Although it cannot pinpoint when corrections will happen, it has predicted declines of 20% or more following previous instances.
Finally, a rapid rise in long-dated Treasury bond yields has heightened Wall Street’s anxiety. While higher yields can please income-seeking investors, they threaten to increase borrowing costs for both businesses and consumers, especially worrying when the U.S. economy appears unstable.
Implications of the S&P 500’s Recent Movements
With a clearer view of the reasons behind recent market fluctuations, it’s essential to focus on the S&P 500’s significant movements. Historical data shows that similar downturns have accurately predicted future stock trends 100% of the time since 1950.
Experiencing double-digit percentage declines within a month is not typical for the S&P 500. Seeing the benchmark index lose over 10% within a month and then recover by more than 10% is exceptionally rare.
According to chief market strategist Ryan Detrick, using data from FactSet spanning January 1, 1950, to May 1, 2025, there have only been seven instances where the S&P 500 lost more than 10% in a month and rebounded more than 10% by month-end. Notably, these instances often coincide with periods of heightened uncertainty and panic, such as the COVID-19 pandemic in March 2020 and the Great Recession of late 2008.
Last month was one of the largest monthly reversals ever. Down 10% MTD at one point, but up 10% off those lows. here‘s what happens next. pic.twitter.com/bpntiSOAhf
— Ryan Detrick, CMT (@RyanDetrick) May 2, 2025
S&P 500 Shows Resilience After Significant Monthly Losses
In the past, the S&P 500 has demonstrated a consistent pattern: after losing more than 10% and subsequently rebounding by over 10% within the same month, it has seen gains one year later 100% of the time. While six instances may seem limited, this historical trend offers a positive outlook.
More noteworthy is the extent of gains seen a year later. Historically, following the previous six double-digit percentage reversals, the S&P 500 has returned an average of 22.1%. This is considerably higher than the long-term average annual return of 9.2% for this benchmark index since 1950.
While past performance offers insights, it is important to remember that no forecasting tool can predict future results with certainty. Hence, it’s possible that the S&P 500 could be lower one year from now.
Gaining perspective can alter perceptions on Wall Street. For instance, data from Crestmont Research, tracking rolling 20-year total returns, reveals that every 20-year period since the early 20th century has yielded profits for investors. This includes scenarios of investing at market peaks, during recessions, or through wars and pandemics. Patience and a long-term focus are crucial for success.
Despite the uncertainties facing Wall Street in the coming months, historical data suggests that the U.S. economy and the companies that drive the Dow Jones Industrial Average, S&P 500, and Nasdaq Composite remain well-positioned for long-term growth.
Should You Invest $1,000 in the S&P 500 Index Now?
Before considering an investment in the S&P 500 Index, note the following:
The Motley Fool analyst team has identified what they believe are the 10 best stocks to consider right now, and the S&P 500 Index is not among them. These ten selected stocks have the potential for significant returns in the upcoming years.
For example, when Netflix made this list on December 17, 2004, a $1,000 investment at that time would have grown to $617,181*.
Similarly, if you had invested $1,000 in Nvidia when it was recommended on April 15, 2005, it would now be worth $719,371*.
The overall average return for the Motley Fool’s recommendations is 909%—outpacing the S&P 500’s return of 163%.
*Motley Fool Stock Advisor returns as of May 5, 2025
Sean Williams has no position in any of the stocks mentioned. The Motley Fool has positions in and recommends FactSet Research Systems. The Motley Fool has a disclosure policy.
The views and opinions expressed herein are those of the author and do not necessarily reflect the opinions of Nasdaq, Inc.


