“`html
Nvidia Soars in Q3, Yet the Market Reacts Cautiously
Nvidia’s NVDA quarterly results stood out, with the chip giant not only surpassing estimates and raising its guidance but also posting significant growth rates reminiscent of young startups. The company’s Q3 earnings surged by +106.3% from a year ago, totaling $19.37 billion. Meanwhile, revenues increased by +93.6% year-over-year, hitting $35.08 billion.
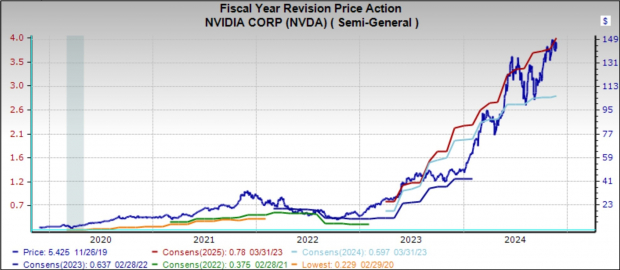
Despite these robust growth figures, the market’s reaction was somewhat muted. To better visualize this, refer to the chart below, which shows Nvidia’s stock price compared to evolving consensus EPS estimates.
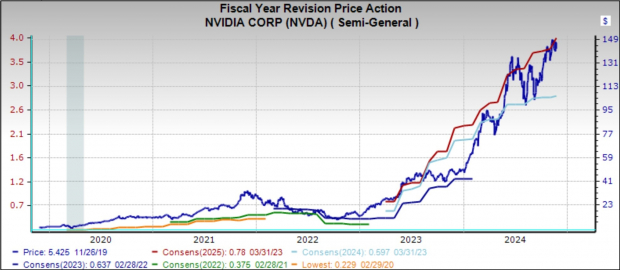
Image Source: Zacks Investment Research
The chart features light blue and red lines representing 2024 and 2025 EPS estimate trends, respectively. The steep rise of these lines indicates that analysts are having a hard time keeping up with Nvidia’s impressive business performance.
Nvidia’s market valuation also reflects its prowess, with a market capitalization of $3.59 trillion, leading the “Magnificent 7” companies, surpassing Apple at $3.45 trillion and Microsoft at $3.07 trillion. The tepid investor response suggests that expectations are sky-high, and the latest guidance, while solid, didn’t match the lofty standards Nvidia has set for itself.
It’s important not to overemphasize the stock’s reaction to Nvidia’s latest quarterly results. The shares have climbed +191.3% over the past year, significantly outperforming the Zacks Tech sector’s +32.5%, the S&P 500 index’s +30.4%, and the Magnificent 7 group’s +20.6%.
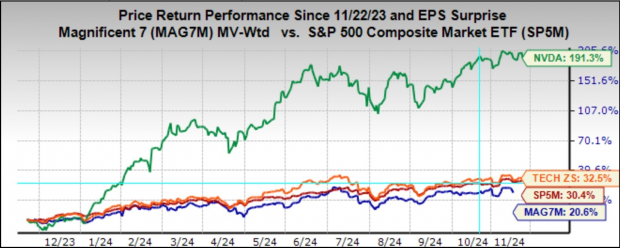
Image Source: Zacks Investment Research
Shifting focus to the Retail sector, several major traditional retailers recently released their quarterly results. As of Friday, November 22nd, 29 out of 34 Retail sector companies in the S&P 500 index had reported their Q3 figures.
As regular readers know, Zacks operates a dedicated sector for retail, distinct from the Consumer Staples and Consumer Discretionary sectors commonly used in standard classifications. This sector encompasses not only Walmart and Home Depot but also e-commerce giants like Amazon AMZN and various restaurant chains.
For the 29 retailers that have reported, total Q3 earnings rose by +12.8% compared to last year, supported by +5.6% higher revenues. Notably, 58.6% exceeded EPS estimates, while only 51.7% surpassed revenue expectations.
The following charts contextualize the percentage of EPS beats in Q3 against historical performance.

Image Source: Zacks Investment Research
From the charts, it’s clear that members of the Zacks Retail sector faced challenges in exceeding estimates this Q3, especially on the EPS front, which is currently tracking below a 20-quarter low.
When examining the growth figures, it is useful to consider the performance of retailers with and without Amazon. Amazon reported a substantial Q3 earnings increase of +71.6% with +11% revenue growth, effectively surpassing expectations for both EPS and revenue.
This trend of convergence between digital platforms and traditional brick-and-mortar stores has become increasingly apparent. With Amazon’s acquisition of Whole Foods, it has become a formidable physical retailer, and Walmart’s expansion into online sales further illustrates this shift, amplified by changes in consumer behavior during the Covid lockdowns.
Two comparison charts below display Q3 earnings and revenue growth in relation to recent periods, both inclusive of and exclusive of Amazon’s data.

Image Source: Zacks Investment Research
Q3 Earnings Season Scorecard
As of Friday, November 22nd, 476 S&P 500 members, or 92.2% of the index, have reported results. Several others, including Dell, HP, and Best Buy, are set to announce their results in the upcoming week.
The aggregate earnings from the 476 companies that reported so far have increased by +8.1% compared to last year, supported by +5.5% higher revenues; 73.7% of these companies beat EPS estimates, while 61.8% surpassed revenue estimates.
Among these members, 51.1% achieved both EPS and revenue estimate beats.
Comparison charts below provide a historical context for Q3 earnings, revenues, and EPS beats.

Image Source: Zacks Investment Research
A key factor affecting overall growth has been the Energy sector, which experienced a -22.9% decline in Q3 earnings and a -2.7% decrease in revenues from last year. If not for this downturn in the Energy sector, overall index earnings would have increased by +10.6% alongside +6.3% higher revenues. The charts below illustrate earnings and revenue growth excluding the Energy sector.

Image Source: Zacks Investment Research
Another set of charts evaluates Q3 EPS and revenue beat percentages in a historical context.

Image Source: Zacks Investment Research
The next charts focus on revenue performance and the blended beat percentages for the group of 476 index members.

Image Source: Zacks Investment Research
The growth trend seems stable, though fewer companies are beating estimates compared to recent periods. Both EPS and revenue beat percentages are currently below the 20-quarter averages.
The Earnings Big Picture
Regarding Q3’s overall performance, by combining results from…
“`
S&P 500 Earnings Expected to Rise Despite Sector Struggles
Analysts forecast an overall 8.1% increase in S&P 500 earnings for Q3, with a 5.7% rise in revenue.
The upcoming companies are projected to boost the S&P 500 index with an estimated earnings growth rate of +8.1% compared to the same quarter last year, supported by a +5.7% increase in revenues.
The chart below illustrates the growth trends in Q3, along with comparisons to the previous four quarters and future projections for the next three quarters.
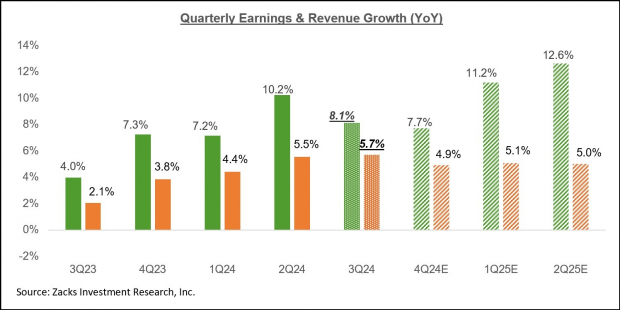
Image Source: Zacks Investment Research
Performance among sectors has been uneven this quarter. The Energy sector is pulling down overall earnings growth, while the Technology sector is providing a significant boost.
If not for the challenges in the Energy sector, S&P 500 earnings could have increased by +10.6% instead of the expected +8.1%. On the other hand, excluding the contributions from the Tech sector, earnings growth for the remaining index members would only reflect a modest +2.9% growth.
Looking solely at the 493 other S&P 500 companies, the anticipated Q3 earnings rise would be a mere +2.4% without the significant impact from the “Magnificent 7” tech companies.
As for the fourth quarter of 2024, total earnings for the S&P 500 are expected to climb +7.7% from last year, alongside a +4.9% increase in revenues.
In contrast to the considerable estimate reductions seen prior to Q3, projections for Q4 appear more stable, as shown in the following chart.
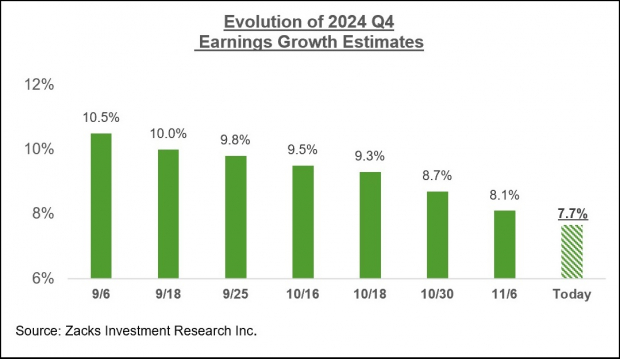
Image Source: Zacks Investment Research
The forthcoming chart presents a broader view of earnings on a calendar-year basis. This year is projected to see a +7.9% earnings growth, followed by promising double-digit gains in 2025 and 2026.
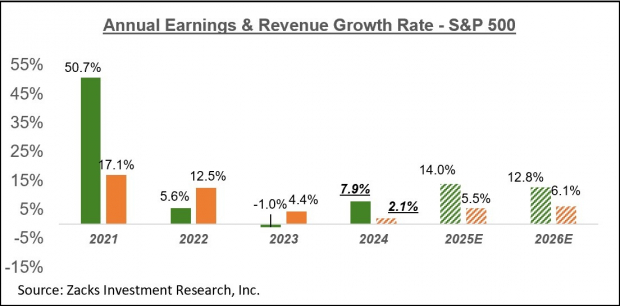
Image Source: Zacks Investment Research
It’s worth noting that the anticipated +7.9% earnings growth improves to +9.9% when excluding Energy’s impact.
For an in-depth analysis of earnings expectations and further insights, refer to our weekly Earnings Trends report >>>> Walmart and Target: A Closer Look at Retail Earnings
5 Stocks Poised for Potential Growth
These stocks were selected by Zacks experts as top candidates to potentially double in value in 2024. Previous recommendations have seen increases of +143.0%, +175.9%, +498.3%, and +673.0%.
Many of these stocks have remained under the radar on Wall Street, presenting an attractive opportunity for investors.
Today, discover these 5 promising stocks >>
For the latest recommendations from Zacks Investment Research, download the report on “5 Stocks Set to Double.” This report is available free of charge.
Amazon.com, Inc. (AMZN) : Free Stock Analysis Report
NVIDIA Corporation (NVDA) : Free Stock Analysis Report
To read this article on Zacks.com, click here.
Zacks Investment Research
The views and opinions expressed herein are those of the author and do not necessarily reflect the opinions of Nasdaq, Inc.


