Since 2019, various asset classes have been under scrutiny for mean reversion effects and associated investment opportunities. Reflecting on key findings from the 2019 Seeking Alpha editors’ pick, “Mean Reversion + Valuation = Portfolio Opportunities,” we will delve into how the landscape has unfolded and glean clues for future performance and top picks. This article represents the 2024 edition of the analysis, building on the previous evaluations.
Revisiting the Outlook from 2019
The December 2019 analysis highlighted several key takeaways:
- U.S. equities are near their highest levels in history, based on valuation metrics. This suggests meager returns of 4-5% per year over the next decade.
- However, based on reversion to the mean and attractive valuations, there are several appealing asset classes.
- U.S. value, international, emerging markets, natural resources, MLPs, and gold present opportunities.
- These assets have the potential for returns ranging from 5.5% per year to 11.6% per year in a Base Case scenario.
- History has shown that it can take years or even decades for a reversal, requiring patient and bold investors to reap the rewards.
The retrospective data from that analysis indicated the prevailing landscape at the time.
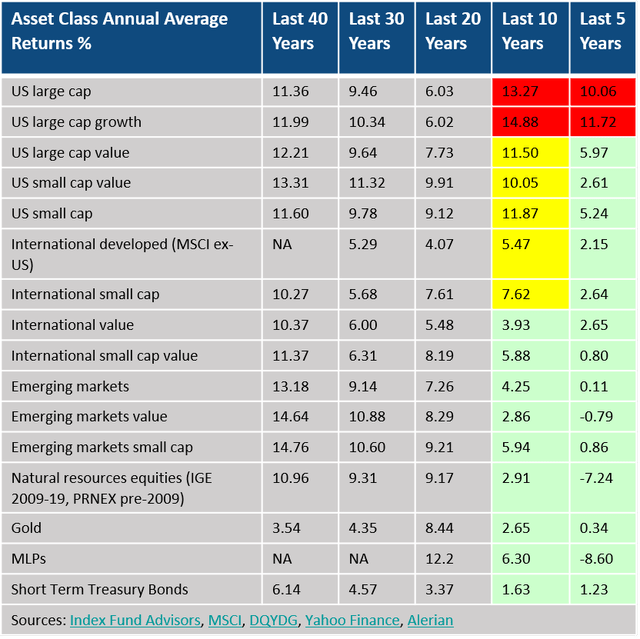
U.S. large cap (S&P 500) and large cap growth sectors had strong returns for the five and ten-year periods ending in 2019, outperforming their 20 and 30-year averages. Conversely, some assets exhibited returns well below their longer-term averages, hinting at potential mean reversion. The analysis raised the question of whether the strength of U.S. large caps and large growth might diminish given their robust performance at the time.
Will the recent subpar performance persist? If so, for how long? … Reversion to the mean often involves the pendulum swinging to the other side of the mean. Those assets that have outperformed swing below their long-term mean returns. Recent underperformers swing to return levels greater than the mean.
Evaluating Performance from 2020-2023
The subsequent years revealed a mixed landscape:
Observing Mean Reversion in Action
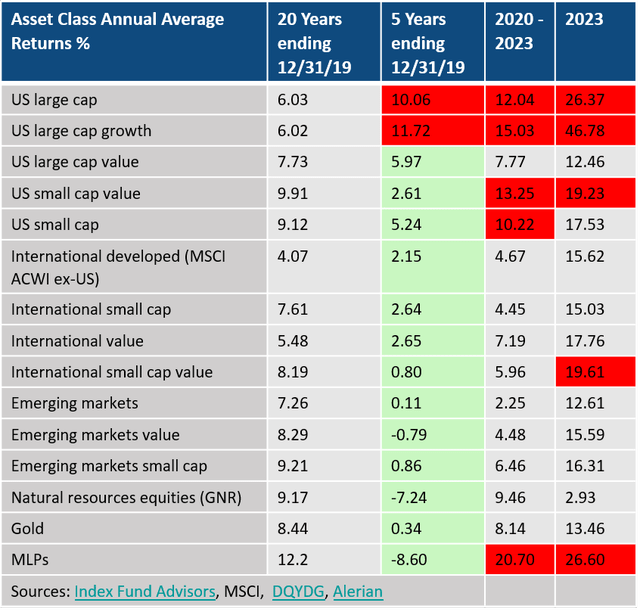
The data pointed to mean reversion in play for almost all categories. Nearly every asset class exhibited improved performance from 2020-2023 compared to the previous five years.
Among the standout performers, U.S. small caps and small cap value recorded double-digit gains, along with a resurgent trend in MLPs and natural resources equities. Notably, the mean reversion calculus brought about a significant swing in returns for these assets, signaling a shift in the investment landscape. Gold also witnessed a notable upturn after a period of stagnation.
The Exception of Large Caps
However, U.S. large cap and large cap growth stocks defied mean reversion expectations, driven by the ascent of the “Magnificent Seven.” This group, encompassing popular FAANGS, spearheaded roughly 60% of the S&P 500’s gains in 2023, propelling large cap growth to a substantial increase.
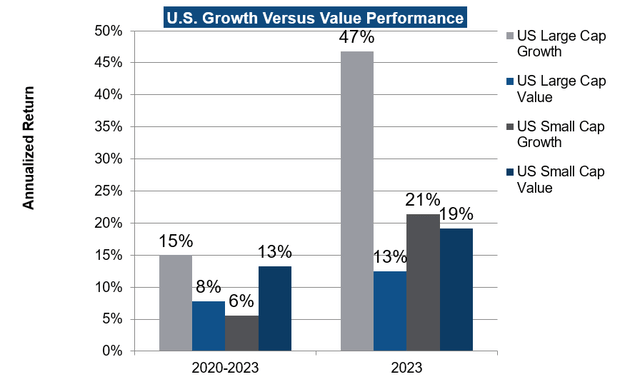
Consequently, U.S. large cap growth stocks outpaced other sectors significantly over the past four years, albeit with remarkable volatility, including a sizeable decline in 2022 followed by a surge in 2023. U.S. large value stocks and smaller sectors also reported gains.
Lagging Foreign and Emerging Markets
On the other hand, foreign and emerging markets equities continued to lag behind their U.S. counterparts. Despite improvements, these sectors struggled to keep pace, influenced by global economic conditions and currency fluctuations.
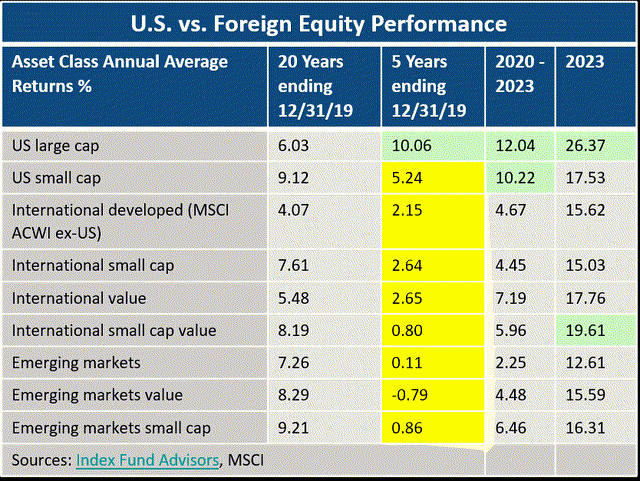
These dynamics attest to the intricate interplay of market forces and the nuanced journey of mean reversion across various asset classes. The evolving narrative underscores the need for investors to adapt to the ever-changing investment terrain, irrespective of established trends or historical patterns.
The Rise of Natural Resources Equities and the Outlook for Mean Reversion Assets
Markets have been a rollercoaster ride with emerging markets taking a hit and a strong dollar exerting downward pressure on foreign equities. But amidst the turbulence, international value has shown signs of life, gaining 7.2% yearly over four years and 17.8% last year. International small cap value made a notable gain of nearly 20% while emerging markets small cap and its U.S. small cap counterpart both saw substantial gains of 16.3% and 17.5% respectively.
Natural Resources Equities Made a 180-Degree Turn, Led by MLPs
In a remarkable turn of events, natural resources equities, especially MLPs, have made a stunning comeback. Despite being beaten up and unloved with a trailing five-year annualized return of -7.2%, the sector has shown incredible resilience. The FlexShares Morningstar Global Upstream Natural Resources Index Fund ETF (GUNR) has seen gains of 62% since meteoric lows. Even a 10% oil price decline in 2023 only resulted in a 3% return for the diversified S&P Natural Resources ETF (GNR). MLPs, in particular, have been a shining beacon, experiencing annualized gains of nearly 21% over the past four years and continued to rally, with the index up 27% in 2023.
Reversion to the Golden Mean
If anyone doubted the appeal of gold, they might now be eating their words. Gold, after returning a mere 0.3% per year over the past five years, has stepped up its game, returning a solid 8.1% per year since, and affirming its status as a great portfolio diversifier, beating the S&P by more than 17 percentage points in 2022 and gaining 13.5% in 2023.
Outlook for Mean Reversion Assets
Looking forward, it’s important to consider historical cycles, valuations, and sentiment effects. Assets seem to follow long cycles, and it’s essential to examine these patterns to make informed investment decisions.
Mean Reversion Runs Through Long Cycles
History teaches us that asset classes run through long cycles. Take a look at the example of U.S. versus foreign equities and their changing leadership since the 1980s and how these cycles have unfolded.
After the dominance of U.S. large and small caps during the 1980s and 1990s, international small caps and emerging markets took charge in the 2000s. However, since the early 2010s, the U.S. has once again assumed the lead. Exploring these waves of performance and the factors driving these cycles, namely valuations and sentiment, is crucial.
The U.S. Market Remains Expensive by Historical Standards
Taking a closer look at the U.S. market, the S&P 500 CAPE (the Shiller P/E Ratio) remains at a historically high level of 32. This level, as per Shiller’s research, has been tied to 10-year forward average annual real returns of only 1% per year. The Buffet indicator also reflects an elevated level, despite a considerable drop from the 2021 post-pandemic P/E.
These long-term valuation metrics raise doubts about the ability of U.S. large caps to sustain their strong performance over the next ten years.
Relative Valuations Remain Favorable for Mean Reversion Assets
Uncovering Investment Opportunities through Market Analysis
As the investment landscape continues to evolve, investors are on the lookout for lucrative opportunities that can provide long-term growth and stability. With a keen focus on valuation metrics and historical performance, individuals are exploring a diverse range of equities, each presenting its own unique potential for substantial returns. Let’s delve into some compelling trends and insights that offer a glimpse into the current market dynamics.
Value Stocks: A Lucrative Proposition in the Current Landscape
In the midst of the market’s intricacies, value stocks hold a strong allure. With large cap growth stocks commanding a P/E ratio of 23X earnings, and large value stocks at a discounted 16X, the potential for value stocks to outperform growth stocks by a significant margin is evident. Notably, the P/E ratio for small cap growth stocks stands at a lofty 26X, while small cap value stocks are priced at a modest 12X, signaling a compelling opportunity for discerning investors.
A historical analysis of the performance of growth versus value stocks since 1978 reveals a noteworthy trend. Post the 2009 financial crisis, growth stocks have consistently overshadowed value stocks. This resurgence of growth stocks has persisted, raising concerns about the sustainability of this pattern. However, history bears witness to the cyclical nature of market dynamics. The 2022 bear market elicited a retraction in the overwhelming growth trend. Yet, by 2023, the scale tipped back, nearing its highest divergence since the dot-com bubble in 1999. The significance of valuations in redefining market trends cannot be overstated, with past periods bearing testament to the pivotal role valuations play in driving investment outcomes.
Historical Evidence: A Guiding Light for Investment Decisions
Looking back at the performance of U.S. small caps, U.S. small cap value, and emerging market equities in 1999 when they exhibited diminished relative valuations, a pattern emerges. In subsequent years, these sectors exhibited astounding annual gains, handily outpacing the S&P. This serves as an emphatic reminder of the profound impact of valuations on investment returns, substantiating the notion that valuations ultimately wield substantial influence on investment outcomes.
Foreign Equities: A Potent Contender on the Global Stage
The dichotomy between U.S. and international equities draws attention to the prevailing outperformance of U.S. equities, extending over nearly 13 years. This unbalanced trend raises the prospect of an imminent reversal in favor of international equities. The current P/E ratios, ranging from 7.6 for emerging markets to 13.3 for international small caps, juxtaposed against the S&P 500’s P/E ratio of 23, further accentuate the compelling allure of international equities. Coupled with the prevailing strength of the dollar, potential market dynamics underscore a definitive opportunity for investors.
Highlighting the relentless cyclical nature of market trends, historical data sheds light on the eventual revival of international and emerging markets equities. The prolonged U.S. equity outperformance, coupled with relative valuations and the evolving outlook for the dollar, portends a potential renaissance for international equities in the foreseeable future.
Natural Resources Equities and Gold: Poised for a Bullish Trajectory
In the realm of natural resources equities and gold, a compelling narrative unfolds. The resurgence of these sectors, underlined by the GNR ETF boasting a modest P/E of 10.2, complements a favorable macroeconomic backdrop, auguring well for the impending years. Notably, MLPs exhibit reasonable valuations, robust cash flow, and tantalizing yields, offering an avenue for investors to tap into this promising segment.
The Dow to Gold Ratio: A Tale of Market Cycles and Relative Peaks
Charting a century-long trajectory of the gold to Dow ratio yields fascinating insights into the ebb and flow of market cycles. Notably, U.S. large cap stocks are perched on the cusp of historical peaks relative to gold, echoing the cyclical fervor that governs market dynamics. However, amid this backdrop, there remains room for stocks to ascend on a relative basis, evidenced by the lingering headroom vis-à-vis the dot-com bubble peak.
As the investment landscape continues to evolve, strategic insights into the valuation metrics and historical performance of equities proffer substantial cues for investors seeking to capitalize on prevailing market dynamics. The intricate interplay of growth and value stocks, the promising resurgence of international equities, and the potential for natural resources equities and gold to chart an upward trajectory underline the multifaceted realm of investment opportunities that awaits astute and discerning investors.
Unlocking the potential for financial gains necessitates a judicious assessment of the prevailing market dynamics, ultimately culminating in informed investment decisions.
Decoding U.S. Stock Market Sentiment: Navigating the Bullish Wave
It’s no secret that investors are firmly bullish according to Elliott Wave Theory. But is the current market sentiment a reliable indicator of future trends? Let’s delve into the intricacies of investor sentiment and U.S. stock market indicators.
Elevated Bullish Sentiment Amid Market Cautions
One of the most telling signs of the market sentiment is the bull/bear ratio, which currently stands at 3.07 according to the latest Investors Intelligence reading. Historically, such elevated levels have often foreshadowed major market tops. However, caution is warranted as it is an imperfect and crude timing tool, as demonstrated by historical precedents.
For instance, in August 2023, the indicator reached the same level when the S&P was trading at 4576. Subsequently, the market soared by 4.5%, proving that short-term trading strategies solely based on this indicator could be misguided. The indicator also failed to anticipate the dotcom bubble burst and missed the mark during the 2003-2005 period.
Another noteworthy gauge of sentiment, the AAII investor sentiment survey, depicts a bullish reading of 48.6% compared to historical averages, indicating a potential market correction in the offing. Nevertheless, the AAII members only study suggests that there’s still room for bullish sentiment to further prevail before any drastic bearish turn.
In summary, while sentiment indicators signal a looming market decline, it’s essential to remember that they are imperfect timing tools, and a comprehensive investment strategy should not solely rely on these metrics.
Navigating Risks and Potential Pitfalls
The resurgence of large cap growth in recent years highlights the uncertainty surrounding market trends. While some asset classes have exhibited signs of revival, history warns that certain sectors may continue to underperform for prolonged periods.
Investors adhering to an all-weather portfolio approach understand the potential hazards of abrupt shifts in asset allocation, as sectors can swiftly reverse their trajectory, undermining previous expectations.
Embracing All-Weather Portfolio Strategies
Amidst the evolving market dynamics, the concept of mean reversion has been a recurring theme. Despite the dominance of the U.S. large cap growth sector, historical trends and diversified portfolio strategies provide comfort to patient investors. These strategies, encompassing relative valuations and diversification benefits, offer solace and stability amidst the fluctuating market sentiment.
In conclusion, the current sentiment indicates the need for careful navigation in the U.S. stock market. Patience, historical context, and diversification are keys to weathering the market’s unpredictable nature. The question remains – will the bullish wave continue, or are we at the brink of a bearish reversal? Your thoughts are much anticipated.


