Ron Finklestien
Significant Monday Options Insights: TTWO, COST, FSLR
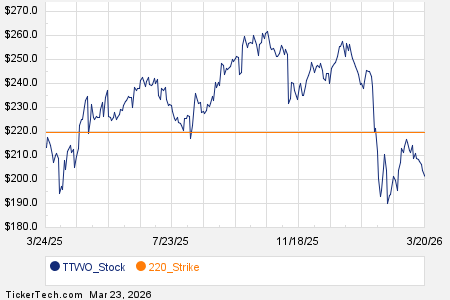
Among the S&P 500 index components, notable options trading activity on October 10, 2023 includes Take-Two Interactive Software, Inc. (TTWO), which recorded a volume ...
Significant Monday Options Trading Trends: GE, FICO, KHC
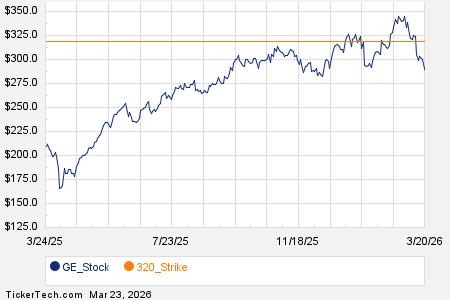
Among the S&P 500 components, notable options trading volume was recorded today for GE Aerospace (Symbol: GE) with 23,785 contracts traded, equivalent to approximately ...
One Trader Remains Concerned as a Successful NDX Put Spread Hedge Rolled to May
In late 2025, specifically on December 29, 2025, a trader purchased 355 of the standard NDX Feb 24700 Puts for 349.80 and sold the ...
Highlighting Monday’s Significant Options Activity: CVGW, GOOGL, WEN
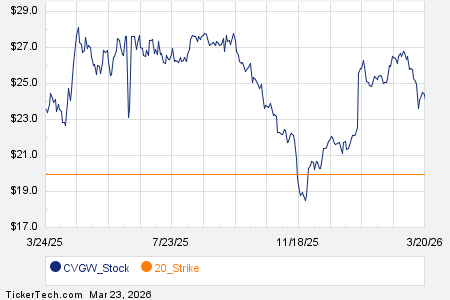
Among the components of the Russell 3000 index, Calavo Growers, Inc. (CVGW) reported a substantial options trading volume today, with 3,179 contracts exchanged, representing ...

Potential Tesla Rivals Worth Considering in 2026
Key Points Tesla (NASDAQ: TSLA) faces intensified competition in the electric vehicle market. Rivian (NASDAQ: RIVN) is set to launch its affordable R2 fleet ...
Monday Market Highlights: Notable Options Activity in HOOD, SNDK, CYRX
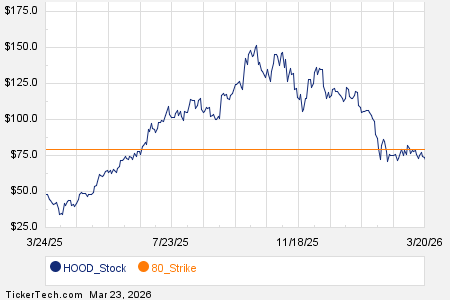
Robinhood Markets Inc (HOOD) has seen significant trading volume in options today, with 185,613 contracts traded, equating to approximately 18.6 million underlying shares. This ...

Could UPS’ Strategy to Cut Amazon Deliveries Lead to Unintended Consequences?
UPS Reduces Business with Amazon United Parcel Service (NYSE: UPS) is reducing its business with Amazon by over 50%, which is expected to be ...

Jensen Huang Discusses Transformative Impact of Agentic AI and the Top Stock to Watch for 2026 Profits
Key Points Alphabet has captured 21% of the enterprise large language model (LLM) market, climbing from 8% since 2023. The company’s Project Mariner, an ...
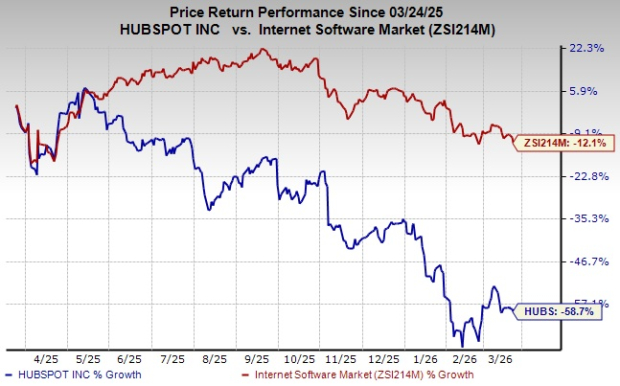
HubSpot’s Strategic Shift Toward AI: A New Era for CRM Development
HubSpot, Inc. (HUBS) is transforming into an AI-driven growth engine, embedding artificial intelligence across its entire product suite to enhance customer engagement and efficiency. ...