Axos Financial Shares Drop Below 200-Day Moving Average
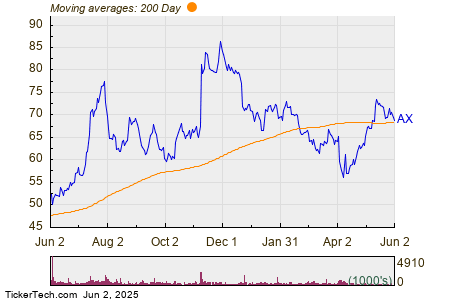
During trading on Monday, Axos Financial Inc (Symbol: AX) saw its shares dip below the 200-day moving average of $68.58, reaching a low of $67.89. Currently, shares are down approximately 0.6% for the day. The following chart illustrates the one-year performance of AX shares against the 200-day moving average:

In examining the chart, AX’s 52-week low stands at $44.10, while the 52-week high is $88.46. The last recorded trade price is $68.87.
Related Information:
- GTA Historical Stock Prices
- Institutional Holders of EMPW
- Top Ten Hedge Funds Holding TRV
The views and opinions expressed herein are the views and opinions of the author and do not necessarily reflect those of Nasdaq, Inc.


