BBUS ETF Sees $183.6 Million Inflow, Boosting Units by 4.4%
This week, the BBUS ETF (Symbol: BBUS) has made headlines with a significant inflow of approximately $183.6 million. This translates to a week-over-week increase of 4.4% in outstanding units, rising from 41,100,000 to 42,900,000.
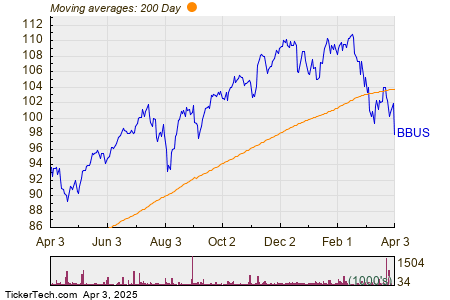
The accompanying chart illustrates BBUS’s one-year price performance compared to its 200-day moving average:

Currently, BBUS’s share price is $97.97. Within the past 52 weeks, the ETF reached a low of $89.171 and a high of $111.04. Evaluating the recent share price against the 200-day moving average is a valuable technique for technical analysis, which can provide further insights into market trends.
Exchange-traded funds (ETFs) function similarly to stocks; however, investors trade “units” instead of “shares.” These units can be exchanged like stocks, but they can also be created or destroyed based on investor demand. Each week, we analyze the change in shares outstanding to identify ETFs with significant inflows (new units created) or outflows (units destroyed). When new units are created, it necessitates the purchase of the underlying holdings, while unit destruction involves selling assets, which can influence the individual securities held within ETFs.
![]() Click here to find out which 9 other ETFs had notable inflows »
Click here to find out which 9 other ETFs had notable inflows »
Also see:
- FN market cap history
- Top Ten Hedge Funds Holding ZPTA
- CYCN Insider Buying
The views and opinions expressed herein are the views and opinions of the author and do not necessarily reflect those of Nasdaq, Inc.


