Best Buy’s Disappointing Q3 Fiscal 2025 Earnings Report
Best Buy Co., Inc. BBY recently released its third-quarter fiscal 2025 results, which revealed financial challenges as both revenues and earnings fell short of analysts’ expectations. Year-over-year comparisons also showed declines in both categories.
Following the announcement, Best Buy’s stock decreased by 2.6% on November 26, reflecting concerns over the weak quarterly performance and a downgraded forecast for the fiscal year. Nevertheless, the company maintained its adjusted operating margin expectations.
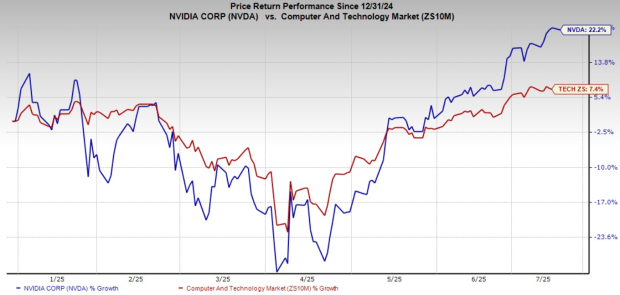
Over the past six months, this Zacks Rank #2 (Buy) company has seen its stock rise 32.7%, outpacing the industry growth of 23%.
A Closer Look at BBY’s Quarterly Performance
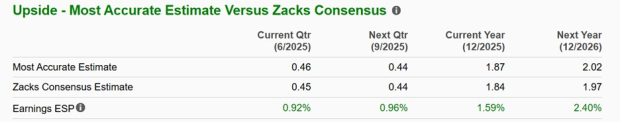
Adjusted earnings came in at $1.26 per share, falling short of the Zacks Consensus Estimate of $1.30. This figure also marked a 2.3% drop compared to $1.29 per share from the same period last year.
Enterprise revenues declined by 3.2% from the previous year’s $9,445 million, missing the consensus estimate of $9,631 million. Enterprise comparable sales dropped by 2.9% year over year, which was worse than the expected 1% decline.
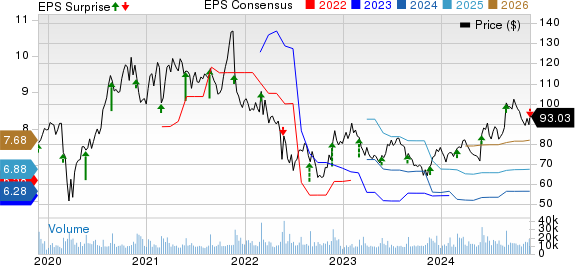
Best Buy Co., Inc. Price, Consensus and EPS Surprise

Best Buy Co., Inc. price-consensus-eps-surprise-chart | Best Buy Co., Inc. Quote
Gross profit fell slightly to $2.22 billion, while the gross margin improved by 60 basis points to 23.5%. This exceeded our projection for a 30 basis points expansion.
Adjusted operating income was reported at $351 million, down from $369 million a year earlier. The adjusted operating margin decreased by 10 basis points to 3.7%.
Adjusted selling, general and administrative (SG&A) expenses remained unchanged at $1.9 billion year over year. However, as a percentage of total sales, SG&A costs rose by 70 basis points to 19.8%, contrary to our expectation of a deleverage of 40 basis points.
Domestic and International Segment Performance
In the Domestic segment, revenues fell by 3.3% to $8,697 million, driven by a comparable sales decrease of 2.8%. Key areas such as appliances, home theater, and gaming saw declines, although this was partially offset by growth in tablets, computing, and services.
We anticipated a 1.1% decrease in the Domestic segment’s revenues. Online sales dropped by 1% to $2.73 billion, but they still represented 31.4% of total domestic revenue, up from 30.6% last year.
The gross margin for the Domestic segment increased by 70 basis points to 23.6% due to better financial results from services, including membership offerings. However, profit-sharing revenues from private label and co-branded credit card arrangements were less favorable. Adjusted operating income for this segment was $338 million, down from $352 million the previous year, maintaining a steady 3.9% of sales.
Across the International segment, revenues fell 1.6% to $748 million, negatively impacted by foreign exchange rates and a 3.7% decline in comparable sales. However, new revenues from Best Buy Express stores opened in Canada mitigated some of the loss. The adjusted operating income for this segment was $13 million (1.7% of revenues), down from $17 million (2.2%) last year, though the gross margin improved by 40 basis points to 22.5% due to growth in higher-margin services.
BBY’s Financial Health
At the close of the quarter, Best Buy reported cash and cash equivalents totaling $643 million, long-term debt of $1.1 billion, and total equity of $3.1 billion.
During the third fiscal quarter, Best Buy returned approximately $339 million to its shareholders through dividends of $202 million and share repurchases of $137 million. Year-to-date through the third quarter, the total returned to shareholders is $892 million, including $607 million in dividends and $285 million in share repurchases. The management plans to spend about $500 million on share repurchases for this fiscal year.
Additionally, the company’s board approved a regular quarterly dividend of 94 cents per share, payable on January 7, 2025, to shareholders of record as of December 17, 2024.
What’s Next for Best Buy in Fiscal 2025?
In light of recent performance, management adjusted its fiscal 2025 revenue estimates, while maintaining guidance for adjusted operating margin. Best Buy now projects revenues to be between $41.1 billion and $41.5 billion, down from an earlier forecast of $41.3 billion to $41.9 billion. The company expects comparable sales to decline by 2.5% to 3.5%, compared to the previous estimate of a 1.5% to 3% dip. In fiscal 2024, consolidated revenues were $43.5 billion, with a 6.8% decline in comparable sales.
The company has reiterated its adjusted operating margin guidance of 4.1% to 4.2%, reflecting slight growth from 4.1% in fiscal 2024. Adjusted earnings per share are now expected to fall between $6.10 and $6.25, adjusted from the earlier forecast of $6.10 to $6.35. Projected capital expenditure stands at $750 million.
For the fourth quarter of fiscal 2025, Best Buy anticipates comparable sales to be flat to decline by 3% year over year, with an adjusted operating margin forecast between 4.6% and 4.8%.
Additional Noteworthy Stocks
We’ve highlighted three stocks with better rankings: Deckers DECK, Boot Barn BOOT, and Abercrombie ANF.
Deckers, which specializes in footwear and accessories, currently holds a Zacks Rank #1 (Strong Buy). The Zacks Consensus Estimate for Deckers’ current financial year indicates a sales growth of 13.6% compared to last year. Deckers has also achieved an average earnings surprise of 41.1% over the past four quarters.
Boot Barn, a retailer focused on western and work-related apparel, carries a Zacks Rank #2. The company experienced an average earnings surprise of 6.8% over the last four quarters, with a projected sales growth of 13.4% for the current financial year.
Abercrombie, a popular casual apparel retailer, also holds a Zacks Rank #2. It delivered a 16.8% earnings surprise in the last reported quarter, with a consensus estimate for current-year sales growth of 13% from the previous year.
5 Stocks Set to Double
This report identifies five stocks selected by a Zacks expert as top contenders to potentially gain 100% or more in 2024. Although past recommendations have yielded remarkable returns of +143.0%, +175.9%, +498.3%, and even +673.0%, not every pick will prosper.
Many stocks featured in this report are currently flying under Wall Street’s radar, presenting an excellent opportunity for early investment.
Latest Earnings Reports: Best Buy Faces Challenges While Others Shine
In an unexpected twist, Best Buy Co., Inc. (BBY) revealed disappointing third-quarter earnings, missing analyst expectations. Meanwhile, Abercrombie & Fitch Company (ANF), Deckers Outdoor Corporation (DECK), and Boot Barn Holdings, Inc. (BOOT) are showcasing more promising results.
Best Buy’s Struggles
Best Buy’s recent performance has raised eyebrows. The retail giant reported that comparable sales fell by 2.9% year-over-year. Analysts had projected a more stable outcome, prompting concerns about the company’s ability to attract customers in a competitive landscape.
Strong Performers in Retail
In contrast, Abercrombie & Fitch (ANF) continues to gain traction, with strategies that resonate with consumers. Deckers Outdoor Corporation (DECK), well-known for its UGG brand, is also reporting strong sales figures, showcasing resilience in today’s market. Additionally, Boot Barn Holdings, Inc. (BOOT) is cultivating a dedicated customer base, further solidifying its position in the retail sector.
Explore More
For those looking to evaluate individual stocks, free analysis reports are available for the following companies:
- Abercrombie & Fitch Company (ANF)
- Best Buy Co., Inc. (BBY)
- Deckers Outdoor Corporation (DECK)
- Boot Barn Holdings, Inc. (BOOT)
For further details, you can read the full article on Zacks.com.
Zacks Investment Research continues to provide insights into the ever-changing landscape of the stock market.
The views and opinions expressed herein are those of the author and do not necessarily reflect those of Nasdaq, Inc.