Significant Inflows Boost Vanguard Long-Term Bond ETF by 13.9%
In the latest analysis of week-over-week changes in shares outstanding among ETFs, the Vanguard Long-Term Bond ETF (Symbol: BLV) has emerged as a notable figure. The fund experienced a remarkable inflow of approximately $736.0 million, representing a 13.9% increase in outstanding units, rising from 77,700,000 to 88,500,000 units.
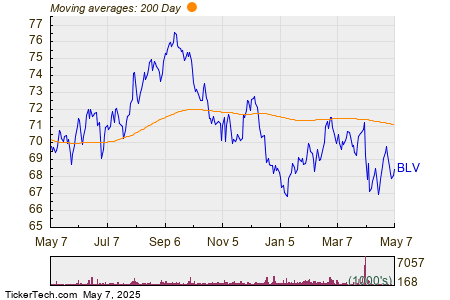
The chart below illustrates BLV’s one-year price performance alongside its 200-day moving average:

Analyzing the chart, BLV’s 52-week price range places its low point at $65.86 per share and its high point at $76.87. As of the last trade, the share price stands at $68.46. Assessing the current share price against the 200-day moving average can serve as a vital technical analysis tool.
Exchange-traded funds (ETFs) operate similarly to stocks; however, investors buy and sell “units” rather than shares. These units can be traded like stocks and can also be created or destroyed to match investor demand. Each week, we examine week-over-week changes in shares outstanding to identify ETFs with notable inflows (new units created) or outflows (old units destroyed). The creation of new units requires purchasing the underlying holdings of the ETF, while the destruction of units typically involves selling those holdings. Consequently, these large inflows and outflows can influence the specific components held within the ETFs.
To discover other ETFs that had significant inflows this week, click here.
Explore Further:
The views and opinions expressed herein are those of the author and do not necessarily reflect those of Nasdaq, Inc.


