lululemon athletica inc. LULU is likely to witness top and bottom-line growth when it reports first-quarter fiscal 2024 results on Jun 5, after market close.
The Zacks Consensus Estimate for fiscal first-quarter sales is pegged at $2.2 billion, indicating a 9.9% increase from the year-ago quarter’s reported figure. The consensus estimate for the company’s fiscal first-quarter earnings is pegged at $2.39 per share, suggesting a 4.8% rise from the year-ago quarter’s actual. Earnings estimates have been unchanged in the past 30 days.
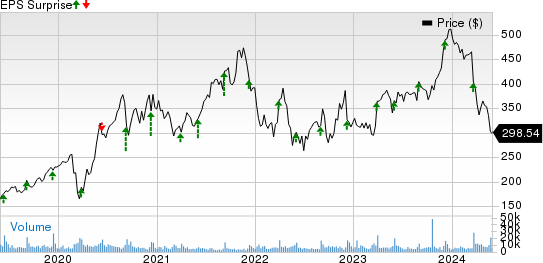
The company delivered an earnings surprise of 5.6% in the last reported quarter. LULU’s bottom line beat estimates by 9.7%, on average, in the trailing four quarters.
lululemon athletica inc. Price and EPS Surprise
lululemon athletica inc. price-eps-surprise | lululemon athletica inc. Quote
Key Factors to Note
lululemon has been benefiting from the continued business momentum, backed by a favorable response to its products. Improvement in store traffic and a solid online show bode well. LULU has been showcasing growth across channels, regions and product categories. This underscores the company’s ability to attract and retain customers, both in-store and online. The persistence of these trends is expected to have boosted the company’s top line in the to-be-reported quarter.
lululemon has been gaining from improved online demand. Its accelerated e-commerce investments to ensure a seamless and convenient shopping experience through its omni-channel retail model bode well. The company has been investing in developing sites, building transactional omni functionality and increasing fulfillment capabilities. Some notable efforts in this space are curbside pickups, same-day deliveries and BOPUS. Gains from these initiatives are likely to get reflected in its first-quarter fiscal 2024 top-line results.
LULU has been on a growth trajectory with the Power of Three x2 growth plan. The plan focuses on three key growth drivers, namely product innovation, guest experience and market expansion. lululemon’s strategic initiatives to increase brand awareness, such as community-based events and brand campaigns, are crucial for attracting customers and strengthening brand loyalty. These efforts help solidify its position as a leading brand in the athleisure space. These efforts are expected to get reflected in the company’s fiscal first-quarter results.
On the last reported quarter’searnings call management anticipated net revenues of $2.175-$2.200 billion for first-quarter fiscal 2024, indicating 9-10% year-over-year growth. It expects the gross margin to be nearly flat with the first quarter of fiscal 2023, with markdowns relatively flat with last year. Earnings per share in the fiscal first quarter are expected to be $2.35-$2.40 per share, whereas it reported $2.28 a year ago.
Our model predicts company-operated stores and the direct-to-consumer channel to register year-over-year revenue growth of 7.5% and 12.5%, respectively, in the fiscal first quarter. Other sales are anticipated to increase 10.5% year over year in the to-be-reported quarter.
Additionally, the company has been witnessing improved gross margins in recent quarters due to lower expenses. Gross margin gains have been resulting from lower air freight expenses, which have been aiding the product margin, as well as a regional mix.
We expect the adjusted gross margin to remain flat year over year at 57.5% in the fiscal first quarter, driven by lower freight expenses, offset by continued inflation. lululemon has been successfully navigating market dynamics and optimizing its cost structures to achieve improved profitability.
However, higher SG&A expenses continue to be deterrents. Increased investments to build brand awareness, technology and essential infrastructure, along with higher depreciation and amortization costs from investments made in fiscal 2022 and 2023, are expected to lead to higher SG&A expenses in first-quarter fiscal 2024. Accelerated focus on fueling its Power of Three X2 plan has also been resulting in higher SG&A expenses.
lululemon anticipates SG&A, as a percentage of sales, to deleverage 130-140 bps year over year for first-quarter fiscal 2024. Our model estimates SG&A deleverage of 130 bps to 38.7% for the fiscal first quarter.
Our model predicts a fiscal first-quarter adjusted operating margin of 18.8%, down 130 bps from the year-ago quarter’s actual. In dollar terms, adjusted operating income is likely to increase 2.9% year over year in the fiscal first quarter.
What the Zacks Model Unveils
Our proven model does not conclusively predict an earnings beat for lululemon this season. The combination of a positive Earnings ESP and a Zacks Rank #1 (Strong Buy), 2 (Buy) or 3 (Hold) increases the odds of an earnings beat. You can uncover the best stocks to buy or sell before they are reported with our Earnings ESP Filter.
lululemon has an Earnings ESP of -3.71% and a Zacks Rank of 3.
Stocks Poised to Beat Earnings Estimates
Here are some stocks, which, according to our model, have the right combination of elements to post an earnings beat:
PVH Corp. PVH currently has an Earnings ESP of +0.70% and a Zacks Rank of 3. The company is expected to register a top-line decline when it reports first-quarter fiscal 2024 results. The Zacks Consensus Estimate for PVH’s quarterly revenues is pegged at $1.9 billion, which suggests a decline of 10.7% from the figure reported in the year-ago quarter. You can see the complete list of today’s Zacks #1 Rank stocks here.
The consensus estimate for PVH’s bottom line moved up by a penny in the last 30 days to $2.14 per share, which suggests in-line earnings with the figure reported in the year-ago quarter. PVH has delivered an earnings surprise of 9.2%, on average, in the trailing four quarters.
Ollie’s Bargain Outlet OLLI currently has an Earnings ESP of +1.80% and a Zacks Rank of 3. The company is anticipated to register top and bottom-line growth in first-quarter fiscal 2024. The Zacks Consensus Estimate for OLLI’s quarterly revenues is pegged at $505.8 million, suggesting growth of 10.2% from the figure reported in the year-ago quarter.
The Zacks Consensus Estimate for Ollie’s quarterly earnings per share was unchanged in the last 30 days at 65 cents per share. The consensus mark suggests 32.7% growth from the year-ago quarter’s reported number. OLLI delivered an earnings surprise of 7.3%, on average, in the trailing four quarters.
Dollar Tree DLTR currently has an Earnings ESP of +0.16% and a Zacks Rank of 3. The company is expected to register top-line growth when it reports first-quarter fiscal 2024 numbers. The Zacks Consensus Estimate for DLTR’s quarterly revenues is pegged at $7.6 billion, which suggests growth of 4.2% from the figure reported in the year-ago quarter.
The Zacks Consensus Estimate for Dollar Tree’s quarterly earnings moved down by a penny in the last 30 days to $1.43 per share, suggesting a decline of 2.7% from the year-ago quarter’s reported number. DLTR delivered a negative earnings surprise of 1.9%, on average, in the trailing four quarters.
Stay on top of upcoming earnings announcements with the Zacks Earnings Calendar.
Research Chief Names “Single Best Pick to Double”
From thousands of stocks, 5 Zacks experts each have chosen their favorite to skyrocket +100% or more in months to come. From those 5, Director of Research Sheraz Mian hand-picks one to have the most explosive upside of all.
This company targets millennial and Gen Z audiences, generating nearly $1 billion in revenue last quarter alone. A recent pullback makes now an ideal time to jump aboard. Of course, all our elite picks aren’t winners but this one could far surpass earlier Zacks’ Stocks Set to Double like Nano-X Imaging which shot up +129.6% in little more than 9 months.
Free: See Our Top Stock And 4 Runners Up
Dollar Tree, Inc. (DLTR) : Free Stock Analysis Report
lululemon athletica inc. (LULU) : Free Stock Analysis Report
PVH Corp. (PVH) : Free Stock Analysis Report
Ollie’s Bargain Outlet Holdings, Inc. (OLLI) : Free Stock Analysis Report
To read this article on Zacks.com click here.
The views and opinions expressed herein are the views and opinions of the author and do not necessarily reflect those of Nasdaq, Inc.


