Meta Platforms Shows Solid Q4 Results Amid Stock Challenges
A month has gone by since the last earnings report for Meta Platforms (META). During this period, its shares have declined approximately 4.2%, underperforming compared to the S&P 500. Investors are now left wondering if the current downward trend will persist ahead of the upcoming earnings release, or if the company is poised for a turnaround. To provide insight, let’s examine the most recent earnings report and key catalysts.
META’s Q4 Earnings and Revenue Exceed Expectations
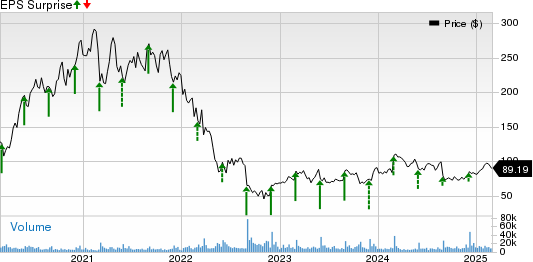
In its fourth-quarter 2024 report, Meta Platforms announced earnings of $8.02 per share, surpassing the Zacks Consensus Estimate by 20.06% and marking a 50.5% year-over-year increase. Revenues reached $48.385 billion, exceeding expectations by 3.02% and reflecting a 20.6% growth year over year. When adjusted for constant currency (cc), revenues grew by 21% year over year.
Strong User Base Drives META’s Top-Line Growth
Most of META’s revenues (97.8%) come from its Family of Apps, including Facebook, Instagram, Messenger, and WhatsApp, which reported a 21.2% year-over-year increase, totaling $47.302 billion. The Family Daily Active People (DAP)—registered users accessing at least one Family product daily—was 3.35 billion, up 5% year over year. Regional revenue growth was particularly strong, with the United States & Canada, Asia-Pacific, Europe, and the Rest of World (RoW) up 17.2%, 23.1%, 21.8%, and 28%, respectively.
Advertising Revenues Surge Year Over Year
Meta’s advertising revenues, constituting 98.9% of Family of Apps revenues, increased by 20.9% year over year to $46.78 billion, accounting for 96.7% of total fourth-quarter revenues. In constant currency, advertising revenues also grew by 21% year over year. Each geographic region showed impressive year-over-year surges: 18% in the United States & Canada, 23.2% in Asia-Pacific, 21.8% in Europe, and 26.7% in RoW. Ad impressions delivered across the Family of Apps grew by 6%, and the average price per ad increased by 14% during the quarter. Additionally, other revenues from the Family of Apps climbed 55.4% year over year to $519 million, while Reality Labs’ revenues (2.2% of total) grew slightly by 1.1% to $1.08 billion.
META Expands Operating Margin Despite Rising Costs
In the fourth quarter, total costs and expenses rose by 5.4% year over year to $25.02 billion, making up 51.7% of revenues, a notable drop from 59.2% in the same quarter the previous year. Family of Apps expenses reached $19 billion, accounting for 76% of overall expenses, primarily due to infrastructure and headcount-related costs. Reality Labs expenses, meanwhile, were $6 billion, rising 6% year-over-year. Operating income surged to $23.37 billion, reflecting a 42.6% increase from a year ago, with an operating margin of 48.3%, up from 40.8% in the prior year. Nevertheless, Reality Labs reported a loss of $4.97 billion, a decline from last year’s loss of $4.65 billion.
META’s Financial Position Remains Robust
As of December 31, 2024, Meta’s cash and cash equivalents, along with marketable securities, totaled $77.82 billion, an increase from $70.90 billion at the end of September. Long-term debt was stable at $28.83 billion, up slightly from $28.82 billion. Capital expenditures jumped to $14.84 billion compared to $9.2 billion in the previous quarter, while free cash flow improved to $15.52 billion, up from $10.9 billion.
Positive Guidance from META
Looking forward, Meta Platforms anticipates total revenues for the first quarter of 2025 to fall between $39.5 billion and $41.8 billion, projecting an 8-15% year-over-year growth, or 11% at constant currency. For the full year 2025, META expects total expenses within a range of $114 billion to $119 billion, alongside projected capital expenditures between $60 billion and $65 billion.
Recent Estimate Trends
In the past month, however, new estimates have shown a downward trend.
VGM Scores Overview
Currently, Meta Platforms holds a strong Growth Score of A, but its Momentum Score lags with a D. Similarly, the stock received a D rating for value, placing it in the bottom 40% of this investment strategy. Cumulatively, Meta has a VGM Score of B, which investors seeking a well-rounded approach should consider.
Market Outlook
With downward trends in estimates, there is hope that revisions will improve. Meta Platforms currently holds a Zacks Rank #3 (Hold), indicating an expectation of an in-line return in the coming months.
Discover Top Stocks for the Upcoming Month
Experts have just released a list of seven elite stocks from the current roster of 220 Zacks Rank #1 Strong Buys, which they identify as “Most Likely for Early Price Pops.” Since 1988, this full list has outperformed the market more than twice over with an average annual gain of +24.3%. Be sure to give these seven stocks your immediate attention.
For the latest recommendations from Zacks Investment Research, you can download the report on the 7 Best Stocks for the Next 30 Days here.
This analysis of Meta Platforms, Inc. (META) is part of a free Stock Analysis report.
This article was originally published on Zacks Investment Research (zacks.com).
Zacks Investment Research
The views and opinions expressed herein are the views and opinions of the author and do not necessarily reflect those of Nasdaq, Inc.