D.R. Horton Predicts Earnings Decline Amid Sales Pressure
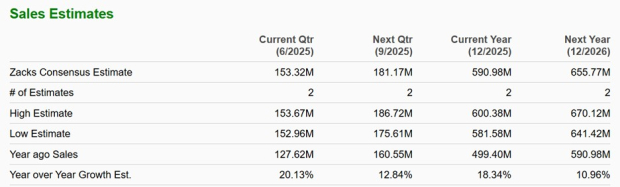
D.R. Horton (NYSE:DHI), a leading American home construction firm, is scheduled to report its fiscal second-quarter earnings on Thursday, April 17, 2025. Analysts forecast the company will deliver earnings of $2.67 per share alongside $8.03 billion in sales. This estimate reflects a significant 24% drop in earnings and a 12% decrease in sales from last year’s tallies of $3.52 per share and $9.11 billion.
Historically, the stock has moved positively following earnings 58% of the time, with an average one-day increase of 3.0% and a peak growth of 10%. Nonetheless, D.R. Horton’s recent 21% decline in sales order backlog during the last quarter (Q1) suggests potential challenges for future revenue. Addressing these issues amid stiff market competition and economic uncertainties will be crucial for maintaining growth in the upcoming quarters. Currently, the company boasts a market capitalization of $38 billion, with $37 billion in revenue over the past twelve months, yielding $5.8 billion in operating profits and $4.7 billion in net income. For investors, the ultimate impact will hinge on how the results measure up against consensus expectations.
Historical Patterns for Event-Driven Traders
For event-driven traders, analyzing historical patterns can provide an advantage, whether by preemptively positioning before earnings or reacting to post-release trends. If your strategy favors reduced volatility compared to individual stocks, consider the Trefis High-Quality portfolio, which has notably outperformed the S&P 500, generating returns exceeding 91% since its inception. Explore the earnings reaction history of all stocks.

Image by Paul Brennan from Pixabay
D.R. Horton’s Post-Earnings Return History
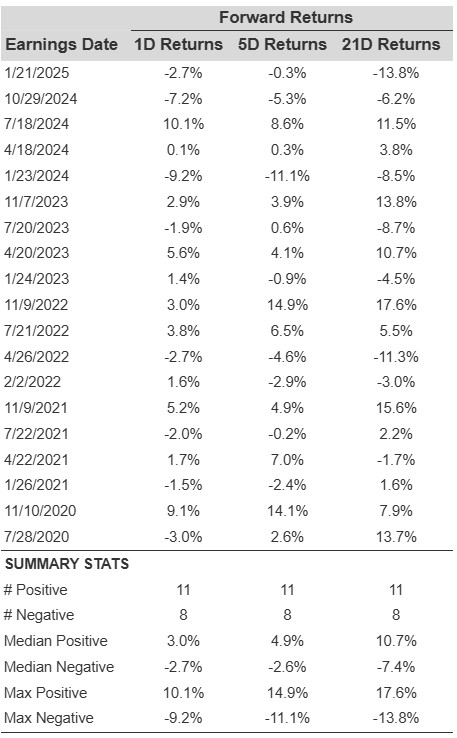
Here are some insights into one-day (1D) returns following earnings:
- Over the last five years, there have been 19 recorded earnings events, resulting in 11 positive and 8 negative one-day returns. This means that positive returns occurred approximately 58% of the time.
- This 58% rate remains consistent when examining results from the last three years.
- The median positive return among the 11 instances is 3.0%, while the median negative return is -2.7%.
Further analysis includes statistical details on 5-day (5D) and 21-day (21D) returns post-earnings, summarized in the table below.
Understanding Correlation Between Historical Returns
Employing a lower-risk strategy involves understanding the correlation between short-term and medium-term returns following earnings. For instance, if the analysis shows a high correlation between 1D and 5D returns, traders can take a “long” position for the upcoming five days whenever the 1D post-earnings return is positive. Here is correlation data based on five-year and three-year (more recent) histories. Note that the correlation referenced as 1D_5D reflects the relationship between 1D post-earnings returns and subsequent 5D returns.

Correlation between DHI 1D, 5D, and 21D Historical Returns
Explore the Trefis RV strategy, which has achieved strong returns, outperforming its all-cap stock benchmark that includes the S&P 500, S&P mid-cap, and Russell 2000.
Invest with Trefis Market-Beating Portfolios
See all Trefis Price Estimates
The views and opinions expressed herein are the views and opinions of the author and do not necessarily reflect those of Nasdaq, Inc.