Restaurant Brands International Set for Q1 Earnings Announcement
Restaurant Brands International Inc. Stock (NYSE: QSR) will report its fiscal first-quarter earnings on Thursday, May 8, 2025. Analysts forecast earnings of 78 cents per share on $2.15 billion in revenue. If these projections hold, this would indicate a 21% year-over-year decline in earnings and a 9% drop in sales compared to last year’s figures of 99 cents per share and $2.35 billion in revenue. Historically, QSR stocks have displayed a pattern of underperforming after earnings announcements, with declines occurring 58% of the time. The median one-day drop is 2.7%, with the largest observed decline being 5%.
Future Growth Strategies for Tim Hortons
In 2025, Restaurant Brands anticipates a return to net unit growth for Tim Hortons, spurred by expansion efforts in rural and less penetrated western Canada. The company plans to allocate between $400 million and $450 million for consolidated capital expenditures, tenant inducements, and various incentives. Currently, Restaurant Brands holds a market capitalization of $30 billion. Over the last twelve months, it reported revenue of $8.4 billion, achieving operational profitability with $2.5 billion in operating profits and net income of $1 billion.
Traders Consider Earnings Data for Decision Making
For event-driven traders, historical trends can provide valuable insights, whether for pre-earnings positioning or reactions to post-release movements. If seeking lower volatility, some traders look at the Trefis High Quality portfolio, which has outperformed the S&P 500, generating returns over 91% since its inception.

Photo by Servetphotograph on Pixabay
Historical Performance Post-Earnings for Restaurant Brands
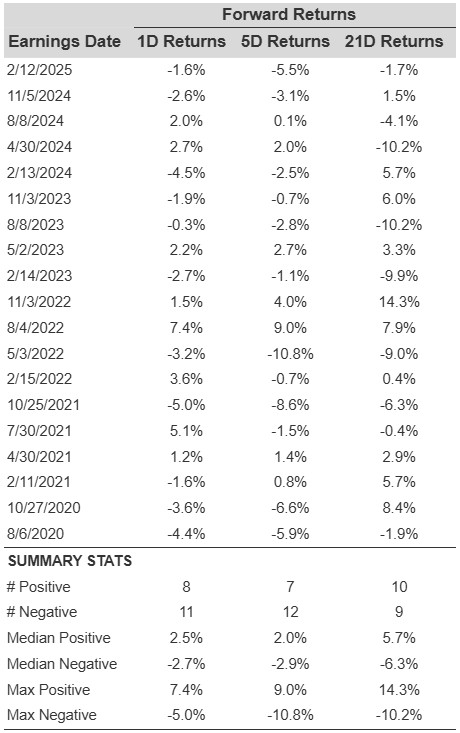
Analyzing the one-day (1D) post-earnings returns provides some notable insights:
- Over the past five years, there have been 19 earnings announcements with 8 positive and 11 negative one-day returns, resulting in positive returns about 42% of the time.
- This percentage increases to 45% when examining data from the last three years.
- The median positive return was 2.5%, while the median negative return was -2.7%.
Additional data on observed 5-Day (5D) and 21-Day (21D) returns following earnings can be found in the accompanying table.
Analyzing Short-Term and Medium-Term Returns
A prudent strategy involves evaluating the correlation between short-term and medium-term returns after earnings releases. Identifying pairs with a high correlation can guide trading decisions. For instance, if 1D and 5D returns are closely correlated, a trader may opt for a “long” position for the next 5 days following a positive 1D result. Historical correlation data from both 5-year and 3-year periods is available.
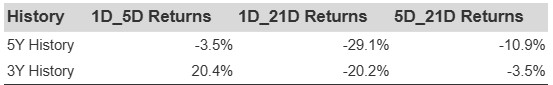
QSR Correlation Between 1D, 5D and 21D Historical Returns
Impact of Peer Performance on Stock Reactions
Peer performance can affect post-earnings stock reactions. Market expectations may begin to adjust ahead of earnings announcements. Historical performance data for Restaurant Brands International Stock compared with peers reporting earnings shortly before them helps provide context for potential stock movements.

The views and opinions expressed herein are those of the author and do not necessarily reflect those of Nasdaq, Inc.