Chart Industries Options: Exploring Selling Puts for Potential Gains
Investors eyeing Chart Industries Inc (Symbol: GTLS), currently trading at $146.94 per share, may find selling puts an interesting strategy if they’re hesitant about the market price. One notable option is the December put with a $120 strike price, which has a bid of $11.20. Collecting this premium yields a 9.3% return based on the $120 obligation, equating to a 13.1% annualized return—referred to as the YieldBoost by Stock Options Channel.
It’s important to understand the implications of selling a put. While this strategy does not provide the investor with direct access to GTLS’s potential upside like owning the stock would, it does offer income through the premium. The put seller would only own shares if the contract is exercised. If GTLS’s share price drops below the $120 strike, an investor might have to consider whether exercising the option makes sense, rather than selling the shares at the current market price. Without a significant decline of at least 18.4% to trigger exercise, the primary benefit for the put seller is the premium income, leading to that 13.1% annualized return.
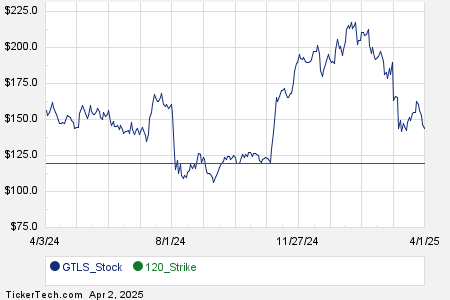
Below is a chart illustrating the trailing twelve-month trading history for Chart Industries Inc, highlighting the position of the $120 strike relative to historical price movements:

This historical chart, alongside the stock’s volatility, can assist in evaluating whether selling the December put at the $120 strike provides a suitable risk-reward ratio given the prospective 13.1% annualized return. The trailing twelve-month volatility for Chart Industries Inc, based on the last 251 trading days and today’s price of $146.94, stands at 53%. For additional put options across different expiration dates, visit the GTLS Stock Options page on StockOptionsChannel.com.
In mid-afternoon trading on Wednesday, S&P 500 put volume reached 837,454 contracts, matching call volume and resulting in a put:call ratio of 0.75. This figure exceeds the long-term median of 0.65, indicating more put buyers in the market than typically expected. Traders are currently engaging more heavily in puts compared to long-term averages.
To stay updated, find out which 15 call and put options traders are talking about today.
![]() Top YieldBoost Puts of the S&P 500 »
Top YieldBoost Puts of the S&P 500 »
Also See:
- Top Cheap Stocks
- Institutional Holders of CHLD
- Institutional Holders of XMVM
The views and opinions expressed herein are the views and opinions of the author and do not necessarily reflect those of Nasdaq, Inc.


