Alternative Strategies for Xcel Energy Investors: Selling Puts
Investors considering a purchase of Xcel Energy Inc (Symbol: XEL) may find themselves hesitant to pay the market price of $66.74 per share. One alternative strategy to explore is selling put options. A particularly interesting option is the December put at the $55 strike, which is currently bid at $1.90. This bid offers a 3.5% return based on the $55 commitment, translating to an annualized yield of 4.9%, a figure we refer to as the YieldBoost at Stock Options Channel.
It is important to note that selling a put does not provide exposure to XEL’s upside potential as owning shares would. The put seller only acquires shares if the contract is exercised, which will occur only if doing so yields a better outcome than simply selling at the current market price. For example, Xcel Energy Inc stocks would need to decline by 17.5% for the strike price to become effective. This results in an effective cost basis of $53.10 per share after accounting for the $1.90 premium, prior to broker commissions. Thus, unless a significant drop occurs, the only gain for the put seller is the collected premium, yielding a 4.9% annualized return.
Interestingly, this annualized rate of 4.9% surpasses Xcel Energy Inc’s current 3.4% annualized dividend yield by 1.5%. An investor looking to buy the stock for dividends would face additional downside risk since the stock price would have to drop 17.54% to hit the $55 strike price.
When discussing dividends, it’s crucial to remember that they are not always stable and fluctuate with the company’s profitability. Reviewing Xcel Energy Inc’s dividend history can provide insight into whether the recent dividend is likely to sustain, and whether a 3.4% annualized yield is a reasonable expectation.

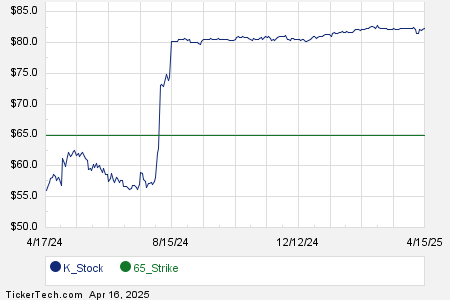
Below is a chart illustrating the trailing twelve-month trading history for Xcel Energy Inc, highlighting the $55 strike in green. This visual can assist in assessing whether the December put option at the $55 strike offers an attractive risk-reward scenario.

The previously mentioned chart, in conjunction with the stock’s historical volatility, can aid investors in determining if selling the December put for a 4.9% annualized rate of return is prudent. Currently, the trailing twelve-month volatility for Xcel Energy Inc, based on the last 250 trading day closing values and today’s price of $66.74, is 19%. For more ideas on put options at various expirations, please visit the XEL Stock Options page on StockOptionsChannel.com.
In mid-afternoon trading on Monday, put volume among S&P 500 components reached 1.80 million contracts, compared to 2.15 million call contracts. This results in a put:call ratio of 0.84 for the day, which is notably high compared to the long-term median put:call ratio of 0.65. This data indicates that there are significantly more put buyers in the options market today than the historical average. For more insights, you can discover which 15 call and put options are trending among traders.
![]()
![]() Top YieldBoost Puts of the Nasdaq 100 »
Top YieldBoost Puts of the Nasdaq 100 »
Also See:
- FSIC Insider Buying
- IRMD Historical Stock Prices
- Institutional Holders of JMI
The views and opinions expressed herein are the views and opinions of the author and do not necessarily reflect those of Nasdaq, Inc.