Costco Gears Up for Earnings Report: High Hopes amid Strong Performance
Costco Wholesale Corporation COST is set to announce its first-quarter earnings this Thursday. Analysts project earnings per share (EPS) of $3.79 and revenues of $62.08 billion to be revealed after market close.
In terms of stock performance, COST has surged 58.01% over the past year and 53.50% year-to-date.
Now, let’s dive into the technical indicators for Costco’s stock and how it lines up with Wall Street’s expectations.
Upcoming Earnings: What to Watch For
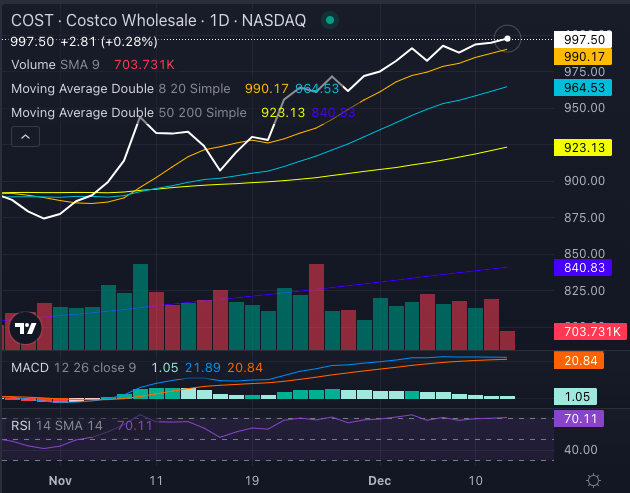
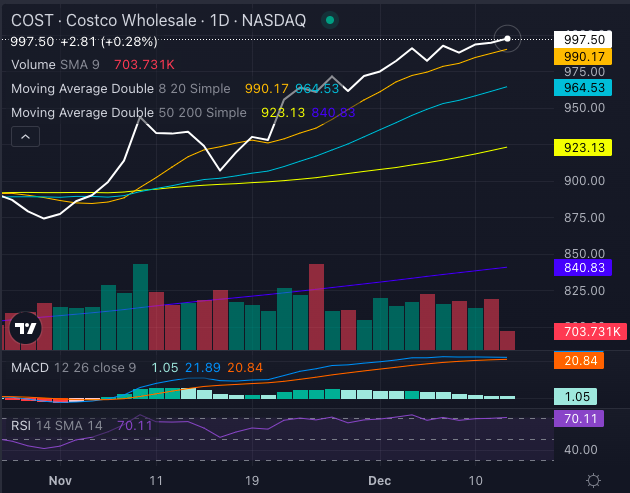
Costco’s stock currently presents a mixed technical view while maintaining a strong bullish trend at a share price of $994.69. The stock is trading above its five-, 20-, and 50-day exponential moving averages, indicating overall positive momentum.

Chart created using Benzinga Pro
Several bullish signals emerge from this positioning, such as the eight-day simple moving average (SMA) at $990.17 and the 20-day SMA at $964.53. The 50-day SMA sits at $923.13, while the 200-day SMA is at $840.83.
The moving average convergence/divergence (MACD) indicator is currently at 21.98, reinforcing a bullish sentiment. Nevertheless, selling pressure is evident, with the relative strength index (RSI) at 70.11, indicating that the stock may be overbought. This scenario could create a risk of price declines despite ongoing bullish trends.
Analyst Ratings & Price Targets
Currently, Costco stock holds a consensus rating of “Buy” among analysts, with an average price target of $954.38. Analysts from Oppenheimer, Jefferies, and Stifel have set a price target that suggests a 7.01% upside, with an average projection sitting at $1,073.33.
Current Stock Performance
As of Thursday at publication, Costco’s stock is trading up 0.46% at $999.30.
What’s Next
Photo: Bluestork via Shutterstock
Overview Rating:
Speculative
Market News and Data brought to you by Benzinga APIs


