Fair Isaac Corporation Shares Dip Ahead of Earnings Report
FICO shares are trading slightly lower on Wednesday, following the announcement that the company plans to release its first-quarter fiscal 2025 results on February 4, right after the market closes.
The Importance of Stock Price Levels: Support and Resistance
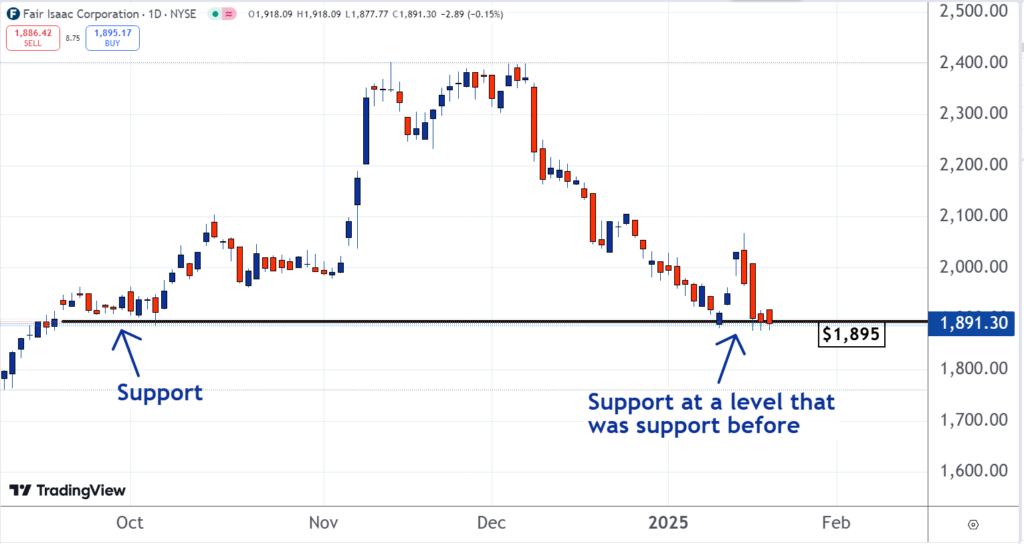
Studying stock charts can provide traders with crucial insights, and Fair Isaac’s chart is particularly telling. This is why our trading team has chosen it as our Stock of the Day.
In the stock market, some price levels hold greater significance than others, often referred to as support and resistance levels.
Understanding Support and Its Role in Market Movements
Support refers to a price level where many investors are eager to buy shares, creating a large demand. Consequently, when there’s a market selloff and prices reach this support, trading often halts or reverses.
Also Read: Dow Jumps Over 500 Points As Trump Takes Office: Investor Sentiment Improves, But Greed Index Remains In ‘Fear’ Zone
Resistance: The Force Holding Prices Back
Conversely, resistance represents a price level where there is significant selling interest. When stock prices rise and hit this resistance, trading usually slows or stalls.
These support and resistance levels derive from investor behavior and trading psychology.
Examples of Psychological Effects on Trading
Take resistance, for instance. It may arise from ‘buyer’s remorse.’ Investors who purchase shares may feel regret if the price subsequently drops. When the price rebounds to their purchase point, many of these investors might sell to avoid further losses, thus transforming a support level into resistance.
Support levels can also form due to ‘seller’s remorse.’ Investors who sold shares at a support level may regret their decision if prices later climb. Driven by the desire to take advantage of favorable prices again, they may place buy orders at that support level, reinforcing it.
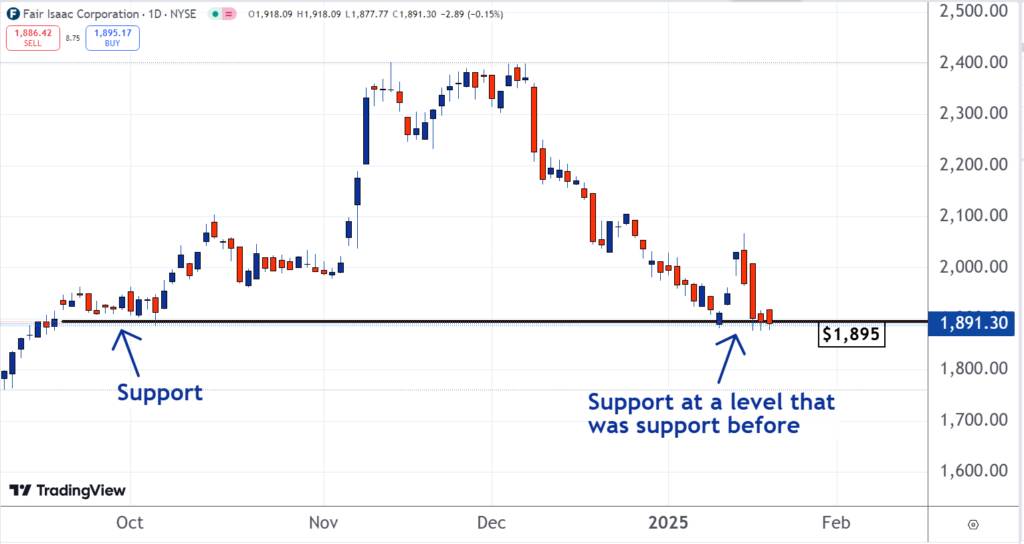
The chart below illustrates that the $1,895 level has become a significant support point for Fair Isaac.

Read Next:
Image: Shutterstock
Market News and Data brought to you by Benzinga APIs


