DFIC ETF Shares Fall Below Key 200-Day Moving Average
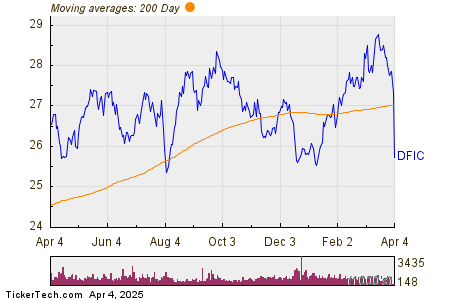
On Friday, shares of the DFIC ETF (Symbol: DFIC) dipped below their 200-day moving average of $27.04, reaching a low of $25.92 per share. Currently, DFIC shares are trading down approximately 5.1% for the day. The chart below illustrates the one-year performance of DFIC shares compared to their 200-day moving average:

The chart indicates that DFIC’s 52-week low is $24.93 per share, while the 52-week high stands at $28.8862. The most recent trade was at $25.77.
Free report: Top 8%+ Dividends (paid monthly)
![]() Click here to find out which 9 other ETFs recently crossed below their 200-day moving average »
Click here to find out which 9 other ETFs recently crossed below their 200-day moving average »
Also see:
- Financial Stocks Hedge Funds Are Selling
- Funds Holding YBTC
- Top Ten Hedge Funds Holding GNRT
The views and opinions expressed herein are the views and opinions of the author and do not necessarily reflect those of Nasdaq, Inc.


