
Dimensional Short Duration ETF Drops Below Key Moving Average
Shares of Dimensional Short Duration Fixed Income ETF face a dip in trading.
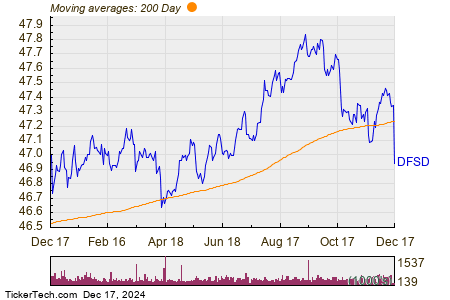
On Tuesday, the Dimensional Short Duration Fixed Income ETF (Symbol: DFSD) saw its shares fall below the 200-day moving average of $47.24, trading as low as $46.90 each. Currently, the shares are down approximately 0.9% for the day. The chart below illustrates the performance of DFSD over the past year relative to its 200-day moving average:

According to the chart, DFSD’s 52-week low is $46.6127 per share, while its 52-week high reached $47.85. The most recent trading point shows shares at $46.93.
![]()
![]() Click here to discover which 9 other ETFs have recently dropped below their 200-day moving average »
Click here to discover which 9 other ETFs have recently dropped below their 200-day moving average »
Also See:
- Historical PE Ratio
- Institutional Holders of OPTI
- LC Price Target
The views and opinions expressed herein are the views and opinions of the author and do not necessarily reflect those of Nasdaq, Inc.


