Put-to-Call Ratio Reaction: Insights into Investor Sentiment
Traders on Wall Street keep a close eye on the put-to-call ratio – a barometer of options activity. A recent surge in call buying has left market skeptics pushing the panic button as the Dow Jones Industrial Average’s put-to-call ratio hit a ten-year high. This spike, although a mark of anxiety and portfolio shielding, is also a signal that historically points towards bull market trends. Seth Golden elaborates on how the Put/Call Ratio’s downward trend may provide a favorable foundation for equities moving forward, all within a lower volatility realm.
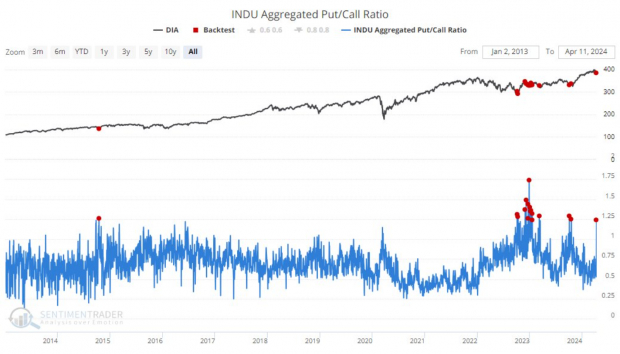
Image Source: Jaso
CNN Fear & Greed: A Peek into Investor Psychology
The CNN Fear & Greed Indicator, tracking a blend of seven market indicators, has shifted from a state of “Greed” to a more apprehensive “Neutral.” This transition, signaling a downturn in market exuberance, has occurred despite a modest retreat in equities fuelled by inflationary pressures this week.
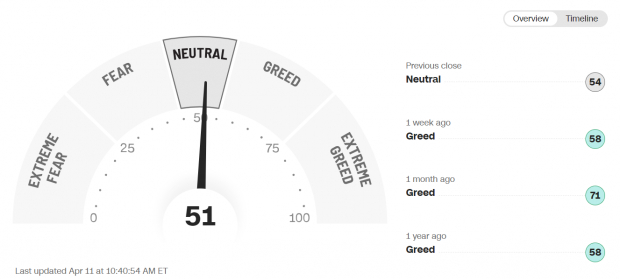
Image Source: CNN
Price Action Analysis: Trusting the Trend
Ryan Detrick from Carson Investment Research likens the current market scenario to a “Rocky Balboa market” – resilient and quick to bounce back after downturns. Riding on the adage of “innocent until proven guilty,” the trend-following approach suggests sticking with the current momentum as it might endure longer than anticipated.
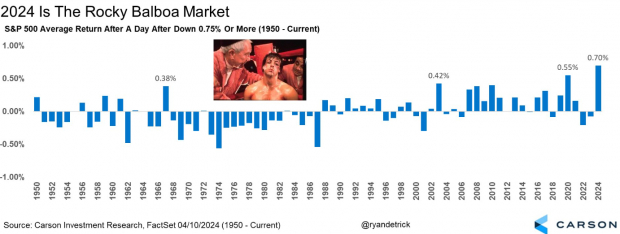
Image Source: Ryan Detrick, Carson Investment Research
Stability in Moving Averages: A Sign of Potential Opportunities
In this bullish market phase, key moving averages are pivotal indicators. The Nasdaq 100 ETF (QQQ) and S&P 500 Index (SPY) are currently testing their upward-trending 10-week averages for the first time in 2024, a zone that typically attracts buyers.
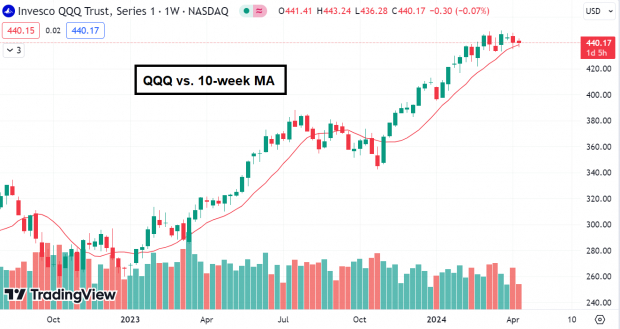
Image Source: TradingView
Net New Highs: A Show of Bullish Dominance
The abundance of stocks achieving net new highs versus lows is a strong indicator of a robust bull market. As long as this trend persists, equities are likely to maintain their upward trajectory without significant reversals.
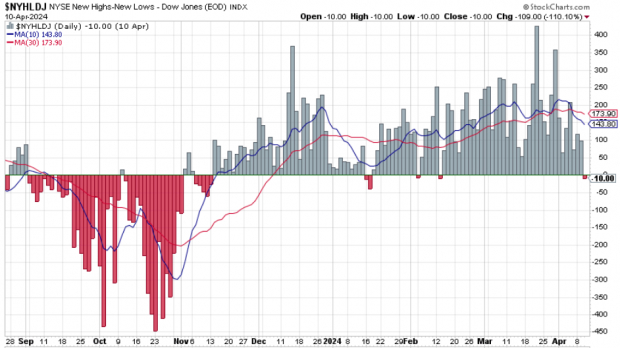
Image Source: StockCharts.com
Only $1 to See All Zacks’ Buys and Sells
We’re not kidding.
Several years ago, we shocked our members by offering them 30-day access to all our picks for the total sum of only $1. No obligation to spend another cent.
Thousands have taken advantage of this opportunity. Thousands did not – they thought there must be a catch. Yes, we do have a reason. We want you to get acquainted with our portfolio services like Surprise Trader, Stocks Under $10, Technology Innovators, and more, that closed 228 positions with double- and triple-digit gains in 2023 alone.
To read this article on Zacks.com click here.
The views and opinions expressed herein are the views and opinions of the author and do not necessarily reflect those of Nasdaq, Inc.
5 Stocks Our Experts Predict Could Double In the Next Year
By submitting your email, you'll also get a free pivot & flow membership. A free daily market overview. You can unsubscribe at any time.