iShares U.S. Home Construction ETF Sees Significant Outflow
The iShares U.S. Home Construction ETF (Symbol: ITB) has reported a notable week-over-week decline in its shares outstanding.
Recently, the ETF faced an outflow of approximately $152.2 million, marking a 5.1% drop from 28,550,000 to 27,100,000 shares. In trading today, some of the ETF’s key components showed mixed performance: Horton Inc (Symbol: DHI) decreased by 0.3%, Lennar Corp (Symbol: LEN) slipped by 0.1%, while NVR Inc. (Symbol: NVR) improved by 0.1%. For a detailed list of all holdings, visit the ITB Holdings page »
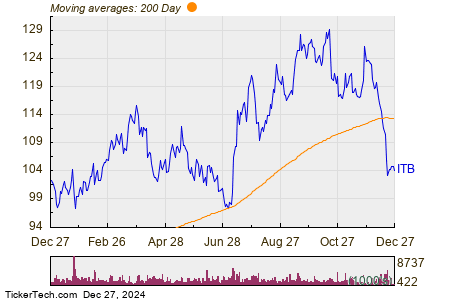
The chart below compares the one-year performance of ITB with its 200-day moving average:

ITB’s 52-week price range has seen a low of $96.97 per share and a high of $129.89, with the most recent trade noting a price of $104.34. This information can be helpful for traders using the 200-day moving average as a technical analysis tool — for more on this, learn about the 200-day moving average ».
Free Report: Top 8%+ Dividends (paid monthly)
Exchange-traded funds (ETFs) function similarly to stocks, with investors buying and selling “units” instead of shares. These units can be traded like stocks, but they can also be created or destroyed based on market demand. We analyze changes in shares outstanding weekly to spot ETFs that may be experiencing significant inflows (indicating new units are being created) or outflows (indicating units are being removed). The creation of new units requires purchasing the underlying assets of the ETF, while the destruction of units means the underlying holdings are sold. Thus, substantial flows can impact the individual components of the ETFs.
![]() Click here to find out which 9 other ETFs experienced notable outflows »
Click here to find out which 9 other ETFs experienced notable outflows »
Also see:
• Funds Holding HUMA
• CPK Historical Stock Prices
• NLIT YTD Return
The views and opinions expressed herein are solely those of the author and do not necessarily reflect those of Nasdaq, Inc.


