Wall Street Insights on IonQ: What Investors Should Consider
Before making decisions about buying, selling, or holding a stock, many investors look to Wall Street analysts for guidance. These analysts’ recommendations can sway stock prices, but how reliable are they?
This article examines the insights from analysts regarding IonQ, Inc. IONQ while highlighting the nuances of brokerage recommendations.
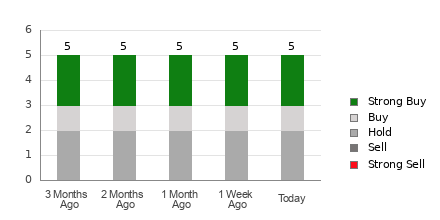
Currently, IonQ holds an average brokerage recommendation of 2.00 on a scale from 1 to 5 (with 1 being Strong Buy and 5 being Strong Sell). This rating is based on recommendations from five different brokerage firms. An average rating of 2.00 suggests that analysts believe the stock deserves a Buy rating.
Among the five recommendations that contribute to this average, there are two Strong Buy and one Buy, which represent 40% and 20% of the total recommendations respectively.
Analyzing IONQ’s Brokerage Trends
While the average rating suggests buying IonQ, relying solely on this information may not lead to the best investment choices. Research indicates that brokerage recommendations often fail to help investors identify stocks with significant price growth potential.
The reason for this lack of effectiveness lies in the conflicts of interest present within brokerage firms. Our findings indicate that for every “Strong Sell” rating, there are typically five “Strong Buy” ratings from these analysts.
This highlights a misalignment between the interests of brokerage firms and individual investors, as the analysts’ ratings may not accurately reflect a stock’s true potential. Consequently, using these recommendations might be better suited as a tool to support your own research rather than as a primary decision-making factor.
The Zacks Rank, a stock rating system with a solid track record, classifies stocks from #1 (Strong Buy) to #5 (Strong Sell). It effectively indicates how a stock is likely to perform in the near future. Hence, comparing the average brokerage rating against the Zacks Rank can offer a more informed basis for investment choices.
Understanding the Differences: ABR vs. Zacks Rank
Even though both the average brokerage rating (ABR) and Zacks Rank use a 1-5 scale, they measure different factors.
The ABR is derived solely from brokerage recommendations, often shown as decimals (for example, 1.28). In contrast, the Zacks Rank is a quantitative model that focuses on earnings estimate revisions and is represented in whole numbers — from 1 to 5.
Brokerage analysts typically maintain an overly positive view of stocks. Ratings often exceed what the research substantiates due to employers’ vested interests, leading to more confusion than clarity for investors.
On the other hand, the Zacks Rank bases its assessments on revisions of earnings estimates, which have shown a strong correlation with stock price movements, according to empirical studies.
Moreover, the different ranks in the Zacks system are proportionally distributed among all stocks analyzed by brokerage firms that provide current-year earnings estimates. This creates a balanced view across the rankings.
Another distinction lies in the timing of updates. The ABR might not always reflect the latest information, while Zacks Rank benefits from prompt revisions of earnings estimates by analysts, ensuring timely insights into future stock performance.
Evaluating the Investment Potential of IONQ
As we consider IonQ’s earnings estimate revisions, the Zacks Consensus Estimate for this year remains steady at -$0.84 over the past month.
This consistent outlook from analysts on the company’s earnings prospects suggests that IonQ might perform in line with market trends in the near future.
The consistency of the consensus estimate, paired with other relevant earnings factors, has earned IonQ a Zacks Rank of #3 (Hold).
As a result, it may be wise to approach the otherwise optimistic ABR of IonQ with caution.
For further details, visit the article on Zacks.com.
© 2024 Benzinga.com. Benzinga does not provide investment advice. All rights reserved.