Understanding the Value of High-Yield Closed-End Funds
Reader feedback has highlighted some persistent misconceptions about income investments, specifically closed-end funds (CEFs) that yield over 8%. It’s essential to correct these misunderstandings to ensure that investors do not overlook the substantial benefits these funds can offer, especially in the current market environment where high dividends can provide critical financial support.
A recent comment on an article I wrote comparing CEFs to exchange-traded funds (ETFs) raised two main concerns:
- The three CEFs I discussed earlier have expense ratios higher than passive funds.
- Cheaper alternatives for purchasing stocks exist compared to the holdings of the CEFs mentioned, such as Microsoft (MSFT), a significant component of all three funds.
Both of these points are valid and often cited by financial advisors. They contribute to the narrative that CEFs should be avoided in favor of ETFs, such as the SPDR S&P 500 ETF Trust (SPY). However, adhering to this advice may lead to overlooking potentially significant dividend income: CEFs yield an average of 8.5%, while SPY offers a modest 1.4% return.
Now, let’s delve into the first concern.
Examining CEF Expense Ratios
While it’s true that CEFs generally come with higher management fees—averaging 2.9%—there’s more to the story. For context, the two specific CEFs we will review, the Virtus Artificial Intelligence & Technology Opportunities Fund (AIO) and the Columbia Seligman Premium Technology Growth Fund (STK), have lower fees at about 2.7% and 1.1%, respectively.
You may also recall that the BlackRock Science and Technology Trust (BST), mentioned earlier, has a fee structure similar to STK at 1.09%. However, I’ll concentrate primarily on AIO and STK today.
One misconception surrounds the impact of these fees on income and total returns. A reader suggested that if AIO’s dividend were reduced by its fees, its yield of 7.8% would drop to 5.1%. This interpretation is incorrect. CEF fees are deducted from the fund’s portfolio before dividends are distributed. Therefore, if AIO offers a 7.8% yield, investors will indeed receive $780 annually for every $10,000 invested. The fees are accounted for at the back end, ensuring reported returns are net of those costs.
When considering whether these fees are justified, it’s important to look at the return potential. An investment in AIO yielding $78,000 on a million-dollar portfolio is significantly more attractive when compared to a low-fee option providing just $14,000 in dividends.
Moreover, CEF fees generally remain competitive due to market pressures. The costs include administrative charges and payments to fund managers, which typically constitute a minimal percentage, around 0.07%. Notably, AIO borrows more than STK for its investments, a factor impacting its fee structure.
The excuse for higher fees is validated by the comparative returns of these funds.
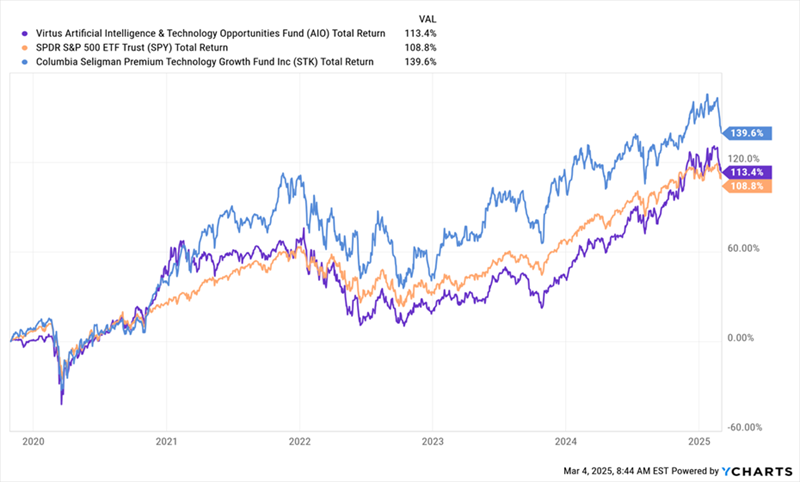
CEFs Outperforming Conventional Indices

The performance of AIO (shown in blue) and STK (shown in purple) confirms that both funds have surpassed the S&P 500 since AIO’s launch in late 2019. STK’s performance extends even further back.
Analyzing Stock Purchase Alternatives
The second claim about finding cheaper stock purchase options is also somewhat valid, albeit perhaps not in the intended sense. Let’s elaborate further.
Cef Premiums to NAV Explained
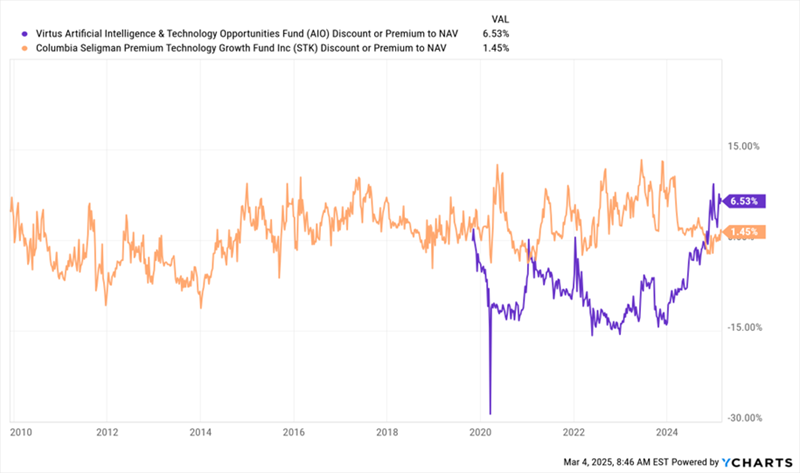
Both AIO and STK operate as closed-end funds, which means they have a limited number of shares available for public trading. Consequently, the market price for these shares can deviate from their net asset value (NAV), depending on demand and supply dynamics.
Currently, AIO trades at a 6.5% premium to NAV, whereas STK holds a more modest 1.5% premium, down from prior highs above 10%. It’s crucial for investors to understand these premiums as they navigate their investment choices without losing sight of CEF spadework.
Exploring Discounted CEFs Offers Better Access to Microsoft
Investors looking to purchase Microsoft (MSFT) at a lower cost than via the AIO fund will find an enticing option—buying through STK. Notably, MSFT constitutes 3.24% of AIO’s portfolio, marking it as the fund’s second-largest position.
However, both options still hold premiums. A more advantageous choice is to invest in a significantly discounted closed-end fund (CEF), specifically the Liberty All-Star Growth Fund (ASG). This fund yields 9.4% and is currently available at a 7.9% discount to its net asset value (NAV), with Microsoft as its top holding at 4% of assets, followed closely by NVIDIA (NVDA) at 3.3%.
Now, let’s examine the potential for “Swappable” CEF Discounts.
Swappable CEF Discounts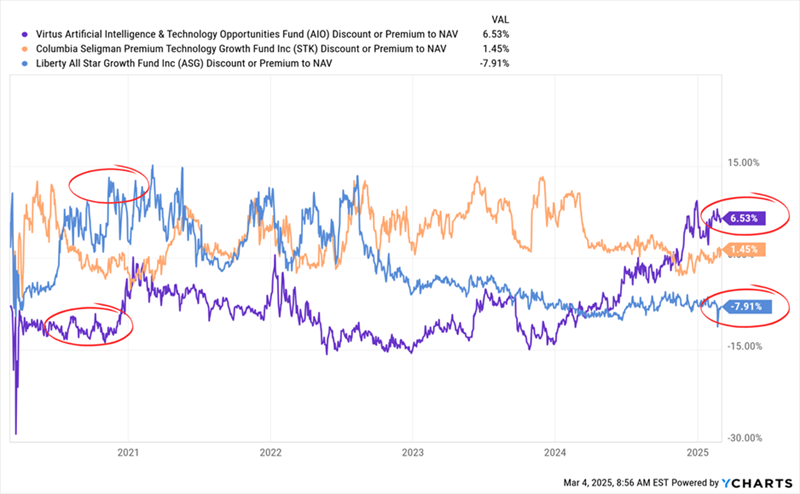
As of this writing, ASG (in blue) trades at a 7.9% discount, while AIO (in purple) is at a 6.5% premium. Interestingly, back in 2020, ASG was trading at a premium while AIO was at a discount.
If you recognize the investment strategy of purchasing ASG when it’s discounted, selling it when it goes to a premium, and then buying AIO at its discounted prices for the reverse trade, you are indeed onto something. This is a well-known tactic in the investment community and one that we regularly pursue at CEF Insider.
Explore CEF Insider for Top Investment Recommendations
The pathway to harnessing the wealth and income potential of CEFs begins with trying them out through a no-risk trial subscription to CEF Insider.
It’s simple. Just click here to discover my four top CEF picks to buy now, highlighting dividends that exceed the average yield of 8% commonly associated with these funds.
You’ll also gain access to a free special report that discloses the names and tickers of these four funds, along with an invitation to test CEF Insider for 60 days at no risk. Click here for all the details and to begin your no-risk trial immediately.
Also Explore:
- Warren Buffett Dividend Stocks
- Dividend Growth Stocks: 25 Aristocrats
- Future Dividend Aristocrats: Close Contenders
The views and opinions expressed herein are those of the author and do not necessarily reflect those of Nasdaq, Inc.