Fidelity’s Tech ETF Sees Significant Inflows as Market Trends Shift
FTEC Gains $133.4 Million in Investments, Reflecting Increased Investor Interest
In a recent analysis of ETF activity, the Fidelity MSCI Information Technology Index ETF (Symbol: FTEC) has shown impressive growth, with approximately $133.4 million flowing into the fund. This equates to a week-over-week increase of 1.0% in outstanding units, rising from 70,400,000 to 71,100,000. Key stocks within FTEC’s portfolio include Qualcomm Inc (Symbol: QCOM), which is down about 1.9%, Amphenol Corp. (Symbol: APH), up about 1.8%, and KLA Corp (Symbol: KLAC), gaining about 0.6%. For a detailed list of all holdings, check the FTEC Holdings page.
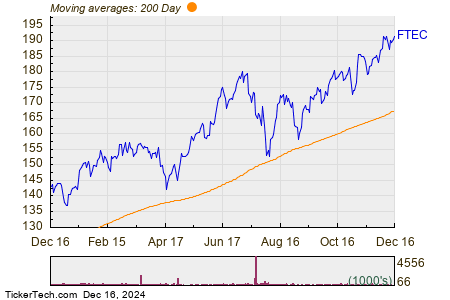
The chart below compares the price performance of FTEC over the past year against its 200-day moving average:

The current price of FTEC stands at $191.55, situated near its one-year high of $192.3566. Notably, the lowest price within this period reached $136.65. Evaluating the recent share price against the 200-day moving average offers valuable insights for investors—find out more about the 200-day moving average for detailed analysis.
Free Report: Top 8%+ Dividends (paid monthly)
Exchange-traded funds (ETFs) function similarly to stocks, but instead of “shares,” investors deal in “units.” These units can be created or destroyed based on demand. Each week, we closely monitor shifts in shares outstanding to identify ETFs experiencing significant inflows or outflows. When new units are created, the underlying assets must be purchased, whereas, in the case of unit destruction, underlying holdings are sold. Such actions can significantly impact the individual stocks within the ETF.
![]() Click here to learn about 9 other ETFs that had notable inflows »
Click here to learn about 9 other ETFs that had notable inflows »
Also see:
- The Online Investor
- ACTG Options Chain
- WBK Historical Stock Prices
The views and opinions expressed herein are those of the author and do not necessarily reflect the opinions of Nasdaq, Inc.


