Franklin U.S. Core Bond ETF Surpasses Key Moving Average
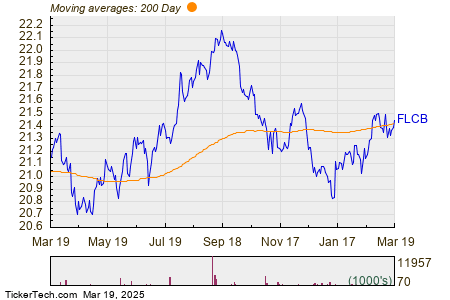
On Wednesday, shares of the Franklin U.S. Core Bond ETF (Symbol: FLCB) moved above their 200-day moving average of $21.43, reaching a high of $21.46 per share. As of the latest update, Franklin U.S. Core Bond shares are trading up approximately 0.2% for the day. The performance chart below illustrates the one-year performance of FLCB shares in relation to its 200-day moving average:

Examining the chart, FLCB’s 52-week low stands at $20.66 per share, while the 52-week high is $22.17. The most recent trade was recorded at $21.44.
Free report: Top 8%+ Dividends (paid monthly)
![]() Click here to find out which 9 other ETFs recently crossed above their 200-day moving average »
Click here to find out which 9 other ETFs recently crossed above their 200-day moving average »
also see:
- Preferred Stock ETFs
- MWA Average Annual Return
- NEE MACD
The views and opinions expressed herein are the views and opinions of the author and do not necessarily reflect those of Nasdaq, Inc.


