

Range Resources Corporation Set to Report Earnings with Promising Growth
Range Resources Corporation (NYSE: RRC), a prominent player in natural gas exploration and production, is scheduled to report its fiscal first-quarter earnings on Tuesday, April 22, 2025. Analysts anticipate earnings of $0.89 per share on $808 million in sales. This forecast indicates an impressive over 2x increase in earnings and a 25% sales growth compared to last year’s results of $0.38 per share and $645 million, respectively. Historically, the stock has increased after earnings reports 50% of the time, averaging a one-day rise of 2.3% and peaking at 9%.
Investor attention will focus on these results, particularly given rising demand for natural gas spurred by LNG exports, power generation, and advancements in AI. Additionally, the colder-than-anticipated winter of 2024-25 has substantially reduced natural gas storage levels, tightening supply and enhancing the price outlook. This evolving market landscape benefits Range Resources, positioning the company to take advantage of heightened natural gas prices. Notably, demand from data centers is expected to quadruple by 2030, especially in the Northeastern U.S., aligning ideally with RRC’s operational strengths and strategic location. The company currently holds an $8 billion market capitalization, with revenue totaling $2.4 billion over the past twelve months, yielding $251 million in operating profits and $266 million in net income. While the performance relative to consensus and expectations will be crucial, understanding historical patterns may benefit event-driven traders.
Event-Driven Trading Insights
For event-driven traders, analyzing historical patterns can provide an advantage, whether preparing for earnings announcements or responding to market moves thereafter. For those seeking potential upside with lower volatility than individual equities, considering the Trefis High-Quality portfolio could be beneficial; it has outperformed the S&P 500 to deliver returns surpassing 91% since its inception. See the full earnings reaction history of all stocks.

Image by Bruce Tunget from Pixabay
Historical Post-Earnings Returns for Range Resources
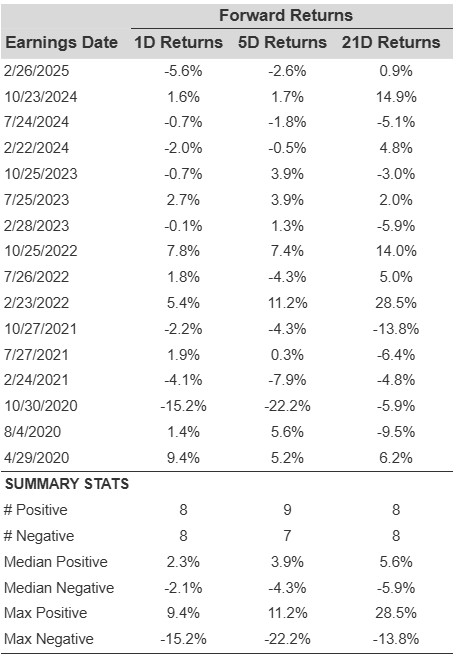
Here are some observations regarding one-day (1D) post-earnings returns:
- Over the last five years, there have been 16 earnings reports, yielding 8 positive and 8 negative one-day returns. Consequently, positive outcomes occurred 50% of the time.
- This probability decreases to 44% when analyzing the last three years instead of five.
- The median return for the positive outcomes stands at 2.3%, while the median for negative returns is -2.1%.
Further data on 5-day (5D) and 21-day (21D) returns following earnings will be summarized in the table below.
Understanding Correlations of Post-Earnings Returns
A less risky approach is to analyze the correlation between short-term and medium-term returns after earnings. By identifying pairs with the highest correlation, traders can execute appropriate strategies. For instance, if the 1D and 5D returns show strong correlation, a trader may take a long position for the subsequent five days following a positive 1D return. Here is the correlation data derived from both 5-year and 3-year histories, noting that the 1D_5D correlation illustrates the relationship between 1D post-earnings returns and subsequent 5D returns.

RRC Correlation Between 1D, 5D, and 21D Historical Returns
Discover more about the Trefis RV strategy, which has outperformed its all-cap stocks benchmark, combining the S&P 500, S&P mid-cap, and Russell 2000 to deliver robust returns for investors.
Invest wisely with Trefis Market-Beating Portfolios
See all Trefis Price Estimates
The views and opinions expressed herein belong to the author and do not necessarily represent those of Nasdaq, Inc.


