Legendary investor Warren Buffett advises to be fearful when others are greedy, and be greedy when others are fearful. One way we can try to measure the level of fear in a given stock is through a technical analysis indicator called the Relative Strength Index, or RSI, which measures momentum on a scale of zero to 100. A stock is considered to be oversold if the RSI reading falls below 30.
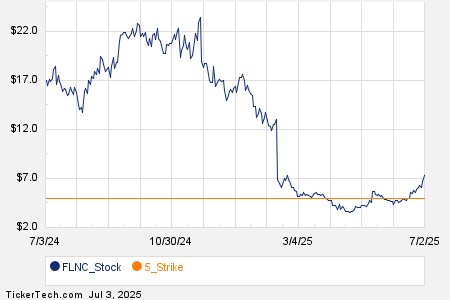
In trading on Monday, shares of Global Industrial Company (Symbol: GIC) entered into oversold territory, hitting an RSI reading of 29.96, after changing hands as low as $39.305 per share. By comparison, the current RSI reading of the S&P 500 ETF (SPY) is 50.1. A bullish investor could look at GIC’s 29.96 RSI reading today as a sign that the recent heavy selling is in the process of exhausting itself, and begin to look for entry point opportunities on the buy side. The chart below shows the one year performance of GIC shares:

Looking at the chart above, GIC’s low point in its 52 week range is $20.52 per share, with $46.965 as the 52 week high point — that compares with a last trade of $39.35.
Free Report: Top 8%+ Dividends (paid monthly)
![]()
![]() Find out what 9 other oversold stocks you need to know about »
Find out what 9 other oversold stocks you need to know about »
Also see:
Funds Holding OSS
SPXU Videos
Funds Holding ETWO
The views and opinions expressed herein are the views and opinions of the author and do not necessarily reflect those of Nasdaq, Inc.