
Significant Options Activity Observed in Russell 3000 Stocks
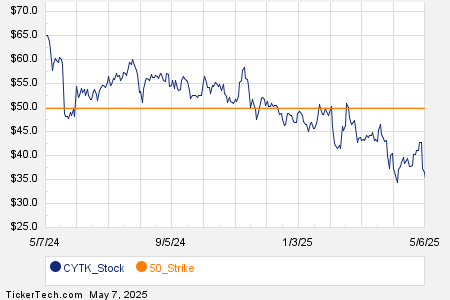
Today, Cytokinetics Inc (Symbol: CYTK) is experiencing notable options trading. So far, a total of 15,632 contracts have been traded, which translates to about 1.6 million underlying shares since each contract represents 100 shares. This volume accounts for 65.2% of CYTK’s average daily trading volume of 2.4 million shares over the past month. A particularly high activity was noted for the $50 strike call option, expiring July 18, 2025, with 10,032 contracts traded, equating to roughly 1 million underlying shares of CYTK. The chart below illustrates CYTK’s trailing twelve-month trading history, highlighting the $50 strike in orange:

Coupang Inc (Symbol: CPNG) is also seeing significant options activity, with a trading volume of 40,359 contracts today, representing approximately 4.0 million underlying shares. This volume corresponds to about 63.2% of CPNG’s average daily trading volume of 6.4 million shares over the last month. Noteworthy activity was seen for the $25 strike put option expiring May 16, 2025, with 4,872 contracts traded, equivalent to approximately 487,200 underlying shares of CPNG. Below is a chart showing CPNG’s trailing twelve-month trading history, with the $25 strike highlighted in orange:

In the case of Dick’s Sporting Goods, Inc (Symbol: DKS), options trading shows a volume of 7,347 contracts thus far today. This volume reflects about 734,700 underlying shares, making up 63.1% of DKS’s average daily trading volume of 1.2 million shares over the past month. High activity was also observed for the $192.50 strike call option expiring May 09, 2025, with 2,220 contracts traded, representing approximately 222,000 underlying shares of DKS. The following chart depicts DKS’s trailing twelve-month trading history, with the $192.50 strike highlighted in orange:

For detailed information regarding various available expirations for options on CYTK, CPNG, or DKS, please visit StockOptionsChannel.com.
![]()
![]() Today’s Most Active Call & Put Options of the S&P 500 »
Today’s Most Active Call & Put Options of the S&P 500 »
Also see:
- MTSI YTD Return
- TA Stock Predictions
- BLTS Market Cap History
The views and opinions expressed herein are the views and opinions of the author and do not necessarily reflect those of Nasdaq, Inc.


