Wholesale Inflation Report Shows Positive Signs, But Market Patience Prevails
This week’s inflation numbers bring relief, but eyes are fixed on the upcoming Consumer Price Index data.
A Look at the Latest Wholesale Inflation Data
The Producer Price Index (PPI), an important measure of wholesale inflation, increased by just 0.2% in December, falling short of the expected 0.4%. Meanwhile, Core PPI, which excludes food and energy costs, remained unchanged.
Year-over-year, PPI rose 3.3%, outpacing November’s 3.0% but did not meet the 3.5% prediction. Similarly, Core PPI also recorded 3.5% year-over-year, which was below the forecast of 3.8% but up from last month’s 3.4%.
As of mid-afternoon, stock and bond markets showed little movement following the data release. All three major stock indexes are trading slightly higher, while the 10-year Treasury yield remains at 4.79%, unchanged from the previous day.
This report offers reassurance to investors concerned about inflation, yet the market’s reaction has been muted. The main reason? Investors are eager to see the Consumer Price Index (CPI) data scheduled for tomorrow.
Understanding What Drives the Current Market
Looking at the broader market context reveals a significant influencer: the 10-year Treasury yield. This figure is crucial for the global economy and impacts investment markets significantly. Fluctuations in the 10-year Treasury yield can dictate stock prices, as higher yields typically lead to lower valuations for stocks because they increase the discount rate applied to future earnings.
Since the Federal Reserve began cutting interest rates in September, the 10-year Treasury yield has surged by more than 100 basis points. Much of this increase occurred amid rising inflation concerns felt in December.
Our expert Luke Lango, writing in his Innovation Investor Daily Notes last Friday, explained recent shifts in market expectations:
Before last Friday, financial markets anticipated about two rate cuts in 2025. Now, they forecast just one cut this year, likely in the third quarter.
This adjustment led to the 10-Year Treasury yield surpassing key resistance at 4.7% and aiming for 4.8%. Current rates are the highest seen in over a year.
Such conditions are challenging for stocks, as high valuations are difficult to justify with a 10-Year yield approaching 5%.
An adjustment is needed: either yields must decrease, or stock prices must fall. We anticipate that yields will drop.
With yields currently high, recent inflation reports could catalyze a reversal in this trend, allowing stocks to rally once again.
So far, Luke’s expectation of softer inflation data has proven accurate, as indicated by the morning’s PPI report.
However, the upcoming CPI data will be critical. Given the current market position, its impact could be particularly pronounced.
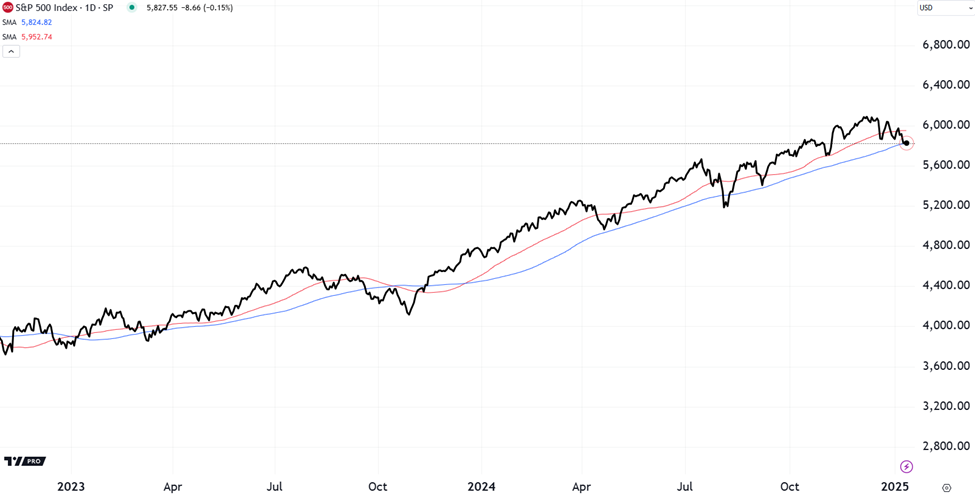
The S&P’s Critical Position on Moving Averages
The S&P 500 is currently positioned right at its 100-day moving average (MA). A moving average is a line on a price chart that represents the average price of an asset over a set period, offering valuable insight into market momentum.
These moving averages heavily influence trading patterns, often triggering buy or sell decisions made by algorithmic trading systems driving professional portfolios.
If the S&P breaks either upwards or downwards from the crucial 100-day MA, quantitative trading programs are likely to react, amplifying the movement.
Currently, the S&P is hovering at its 100-day MA. In the following sections, we will further examine this situation alongside the S&P’s 50-day MA over the past two years.
During bullish phases, the 50-day MA (represented in red) has been a reliable support level, lifting the S&P higher after minor declines. Conversely, when the 50-day MA fails to hold, the 100-day MA (shown in blue) typically offers support.
Next, let’s look at the charts to see these dynamics at play:

Source: TradingView
Upon closer examination, it becomes clear that the S&P dropped below the 50-day MA last week and now rests right on the 100-day MA (circled in blue).
 trading right on its 100-day MA” class=”aligncenter wp-image-3271849″ srcset=”https://investorplace.com/wp-content/uploads/2025/01/sp-close-up.png 975w, https://investorplace.com/wp-content/uploads/2025/01/sp-close-up-300×154.png 300w, https://investorplace.com/wp-content/uploads/2025/01/sp-close-up-768×395.png 768w, https://investorplace.com/wp-content/uploads/2025/01/sp-close-up-200×103.png 200w, https://investorplace.com/wp-content/uploads/2025/01/sp-close-up-400×206.png 400w, https://investorplace.com/wp-content/uploads/2025/01/sp-close-up-116×60.png 116w, https://investorplace.com/wp-content/uploads/2025/01/sp-close-up-100×51.png 100w, https://investorplace.com/wp-content/uploads/2025/01/sp-close-up-97×50.png 97w, https://investorplace.com/wp-content/uploads/2025/01/sp-close-up-78×40.png 78w” sizes=”(max-width: 975px) 100vw, 975px”>
Source: TradingView
Thus, we anticipate tomorrow’s CPI data will offer insights into inflation trends, influencing the 10-year Treasury yield, which in turn will dictate stock market movements—all taking place as the market balances precariously at its 100-day moving average.
Forecasting Market Reactions Based on CPI Results
If tomorrow’s CPI data reflects lower inflation, we could see increased market optimism…
Analyzing Potential Market Moves from the 100-Day Moving Average
What to Expect if the S&P Rally Continues
If the S&P 500 rallies off the 100-day moving average (MA), we should anticipate gains between 4% and 6% in the coming weeks. This projection draws from the S&P’s performance after similar rallies in the last two years.
Could We See a Decline Below the 100-Day MA?
Conversely, if the upcoming data falls short of expectations and leads the index below its 100-day MA, it’s vital to understand how much further it might drop. In the past two years, the S&P has experienced declines of 2% or more below this line during the following instances:
- March 2023: fell approximately 2.1% below its 100-day MA
- September 2023: dropped about 5.8% below its 100-day MA
- August 2024: hit a low roughly 2.3% under its 100-day MA
These declines were not as severe as one might fear. However, an additional 2% to 6% decline would be uncomfortable, compounding the S&P’s 5% pullback since December. Historically, such pullbacks aren’t disastrous.
Impact of High Inflation on Market Conditions
Heightened inflation could disrupt this outlook significantly. If inflation figures exceed expectations, the 10-year Treasury yield could spike to 5%. Such a scenario may lead to a more troublesome market correction.
Historical Context on Market Corrections
Reflecting on stock market behavior, Schwab’s analysis shows that corrections occur more frequently than many investors realize. According to their report:
Market corrections are more common than you might think…
Since 1974, following corrections, the S&P 500 has typically increased by an average of over 8% one month later and over 24% a year later…
Further examining intra-year declines from 2002 to 2021, notable trends emerged. A drop of at least 10% happened in half of those years, averaging 15%. Yet, stocks continued to rise in most cases, yielding positive returns for the majority of years surveyed.

Source: Schwab Center for Financial Research with data provided by Standard & Poor’s.
This historical insight backs Luke’s belief in continued market growth for 2025.
Looking Ahead to Market Volatility
Luke shares this perspective: this year is likely to be strong for stocks, but with notable volatility ahead. His advice? “Buy when the market takes a step back; sell during the two steps forward.”
As we currently see a step back, expect two steps forward soon enough. Patience is essential as market fluctuations may become a familiar trend in 2025, but strong gains are also anticipated.
Anticipating Tomorrow’s CPI Report
With one inflation report behind us, which was below expectations, the focus shifts to tomorrow’s CPI report and the critical position of the S&P at its 100-day MA.
We will keep you informed here in the Digest.
Wishing you a pleasant evening,
Jeff Remsburg