As the curtains closed on the year 2023, the U.S. IPO market left much to be desired, with negative median returns and a stabilizing deal volume. The disappointment was further exacerbated by the underperformance of Asia-Pacific region-based companies and the drag resulting from IPOs priced at $5 per share or lower.
However, hope shines on the horizon as we turn our attention to the year 2024, with prevalent predictions for incremental increases in deal volumes. This optimism is tempered by the acknowledgment that the public market/private market valuation gap, especially in the technology subsectors, will persist. Notably, private market valuations continue to overshadow public valuations.
2024 is expected to unveil a handful of quality IPOs sprinkled throughout the year. Investors are advised to focus on companies with a robust history of revenue growth and either lowering operating losses or burgeoning profits.
This period presents an opportunity for investors to gravitate towards IPO companies backed by substantial track records and easily understandable business models. It calls for a prudent approach while eschewing hype-induced behaviors and exercising utmost discipline in IPO investment choices.
The Bittersweet Memory of 2023 U.S. IPO Activity
In 2023, a total of 141 IPOs raised $22.2 billion in gross proceeds, excluding underwriter options and concurrent private placements. Although this reflected a 15.1% decrease in the number of IPOs compared to the previous year, there was a 21.3% increase in the gross proceeds raised, hinting at a trend of a smaller number of larger IPO sizes.
Despite the promising gross proceeds, the median return for all 2023 U.S. IPOs through the end of the year was a disheartening negative 22%. This poor performance can be largely attributed to the negative impact on valuations for growing but money-losing companies in a higher cost-of-capital environment.
Comparatively, the median return for all 2022 U.S. IPOs through the end of that year was a paltry 0.3%. Although a meager result, it stands head and shoulders above the substantially negative performance of 2023.
A chart depicting the number of U.S. IPOs on a quarterly basis since Q1 2015 vividly illustrates the erratic IPO activity over the years. The chart reveals a sharp rise in IPO activity during the pandemic years of 2020 – 2021, followed by a plummet when the pandemic waned and inflation ensued.
The decline in IPO activity was also evident in the number of SPAC IPOs, which sharply dropped from 73 in 2022 to 27 in 2023. Additionally, a critical rule change by the SEC led to an exodus of major investment banks from the SPAC market, signaling a significant shift in the landscape.
The seasonal variation of the number of IPOs throughout the year is showcased in another chart, with the first quarter emerging as the busiest quarter of the year. These fluctuations serve as a reminder of the market’s capricious nature.
U.S. IPOs by Industry: Unveiling the Leading Sectors
Throughout the year, a total of 38 industries were represented with at least one IPO. Notably, 20 industries saw only one IPO, signifying a broader distribution compared to the previous year.
SPACs led all industries with 27 IPOs, followed closely by biopharma and consumer firms, each contributing 18 IPOs. Financial services and transportation companies were also well-represented by eight IPOs each.
The distribution of IPOs by industry is further elucidated in a chart, offering a visual representation of the varying levels of participation across sectors.
Additionally, a pie chart breaks down the number of IPOs by industry, portraying the percentage contribution of each sector to the total, offering a different perspective on the data.
U.S. IPOs by Country of Origin: A Global Perspective
U.S.-based companies accounted for 79 of the 141 total IPOs, representing 56% of the total. This percentage witnessed a noticeable decrease from 2022, highlighting the increased international IPO sources during 2023.
China emerged as the second most prolific source with 29 IPOs, up from 7.2% of the total in 2022. Japan’s output tripled from two IPOs in 2022 to six in 2023, adding to the diversification of the IPO landscape.
Israel, Singapore, and Malaysia also witnessed significant changes in their IPO outputs, signaling an expanding global footprint in the IPO market. The summary chart of IPOs by country of origin provides a clear overview of this global participation.
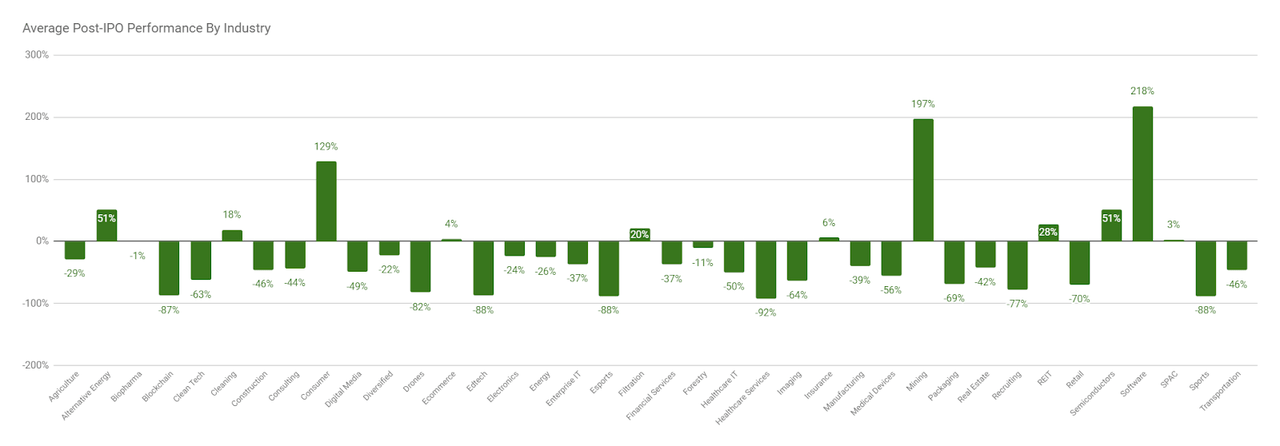
Average Percentage Return Since IPO by Industry: A Tale of Varied Fortunes
Decline in 2023 IPO Returns Reflects Unimpressive Investment Landscape
The year-end results for U.S. IPO returns have elicited more groans than cheers from investors. With a median drop of 22% in aggregate, the performance in 2023 hardly paints a rosy picture. However, amidst this sea of red, a few industries managed to defy the trend and produce positive returns. Let’s delve into the specifics of this up-and-down rollercoaster of an IPO market.
Among the triumphs were the general software, mining, and consumer categories, which chalked up average returns of 218%, 197%, and 129%, respectively, from their IPO date through the year’s end. Conversely, the healthcare services, edtech, sports, and eSports industries found themselves at the bottom of the heap, plummeting by 88% or more by the end of the calendar year.
Some well-capitalized biopharma firms, including Adlai Nortye (ANL), Acelyrin (SLRN), and Turnstone Biologics (TSBX), experienced a disappointing post-IPO performance, grappling with significant drops in their stock prices.
The following chart illustrates the average percentage returns since IPO by industry for all IPOs in 2023, from the IPO date through the calendar year’s end:
In addition, several notable names claimed substantial IPO sizes, with semiconductor technology company Arm Holdings (ARM) leading the pack at $4.9 billion. However, the size of the IPO didn’t necessarily translate to a success story. Arm’s IPO returned 47% by year-end, whereas Johnson & Johnson spin-out Kenvue (KVUE) and footwear maker Birkenstock (BIRK) were met with negative stock returns of (2%) and 6%, respectively.
2023’s Poorly Performing IPO Categories Bear Cautionary Tale
Part of the allure of investing lies in navigating the treacherous terrain of what not to invest in, to sidestep potential losses. 2023 bore witness to two categories of U.S. IPOs that generally languished in the post-IPO phase: Asia-Pacific companies and IPOs with stock prices of $5 or less.
Upon reflection, the dismal performance of these categories stemmed from several egregious missteps:
Small-cap Companies from Asia-Pacific countries
-
These companies, usually from China but increasingly from other Asia-Pacific nations, are often championed by networks collaborating with small U.S.-based investment banks entrenched in U.S. Asian communities. This strategy aims to sell shares to the Asian diaspora in the U.S. However, if the IPO doesn’t instantaneously “pop,” these investors may swiftly divest their shares.
-
Asia-Pacific IPO firms are typically small entities with complex legal structures, often domiciled in the Cayman Islands as a U.S. entity, with only a contractual arrangement or a Wholly Foreign-Owned (WFOE) subsidiary with the Chinese operating entity. Consequently, U.S. investors do not hold stock in the operating entity.
-
Communication from Asia-Pacific company executives seldom aligns with the level of transparency typical in larger, established public companies familiar to U.S. investors. Notably, their communications tend to be cryptic, ambiguous, and rife with vacuous platitudes of minimal value to investors.
-
These firms frequently face capricious and opaque regulatory changes, favoring larger companies. The unpredictable nature of these changes tends to favor larger entities, as Asia-Pacific regulators find it more expedient to govern a smaller number of large firms rather than a multitude of smaller businesses.
-
Asia-Pacific companies often lack a singular focus, choosing instead to dilute their efforts across disparate business segments, resulting in lackluster outcomes.
The tabulated data underscores the abysmal median return of negative 22% for all Asia-Pacific country IPOs from the IPO until the end of the year. Contextually, with only 24% of Asia-Pacific companies ascending by year-end compared to 40% of all U.S. IPOs, the category incontrovertibly underperformed, yielding a median return of negative 22%.
Companies with U.S. IPO Pricings at $5 or Less
-
These companies opt for IPO prices of $5 or less, primarily targeting retail investors due to the challenge in piquing institutional or private investor interest.
-
They tend to be minuscule, micro-cap entities with limited revenue, substantial losses, or a brief operating history.
-
Often, they operate in digital-focused industries with an abundance of hype but few tangible results.
-
Many of these entities are “narrative” companies, seeking to raise a few million in investment based on speculative visions of the future, which may or may not materialize.
-
Management typically lacks direct industry experience or a track record of measurable successes.
-
They typically fall under the “emerging growth” or “smaller reporting” company bracket, allowing them, as per the 2012 JOBS Act, to sidestep several public disclosures mandated for conventional public companies.
The outcomes for stocks priced at or below $5 revealed a median return of negative 20% by year-end, with a mere 14% surpassing their IPO prices compared to the overall market average of 40%.
Insightful Analysis of the U.S. IPO Market in 2023 and 2024
The 2023 IPO market again saw a reduction in overall deal volume versus the previous year but an upward dollar amount of gross proceeds. If 2022 was the “hangover after the pandemic IPO party,” then 2023 was a consolidation and recovery period of sorts.
A Year of Tepid Performance
Leading 2023’s tepid performance were money-losing small and mid-cap technology companies, which suffered disproportionately due to a higher cost-of-capital environment, which reduced valuations accordingly. Many management teams chose to avoid going public due to the ongoing “valuation gap” between public valuations dropping sharply versus private valuations falling less so. Additionally, the quality of many companies going public in 2023 was poor, with many small firms seeking to take advantage of $5 IPO prices to ensnare unsuspecting retail investors only to produce generally poor results and quickly destroy shareholder value.
While there were a few periods during the year where investors hoped for a revived market, such as when semiconductor design firm ARM Holdings (ARM) went public, these stock market debut performances were generally muted, and enthusiasm subsequently waned. As the year progressed into the last quarter, an increasing chorus of predictions about interest rate reductions turned out to be somewhat prescient as the Federal Reserve’s December meeting produced expectations of a drop in rates throughout 2024.
Whatever the trajectory of macroeconomic conditions in 2024, the U.S. IPO market, given the poor performance of many 2023 IPOs, is likely to experience only a modest rebound. While year-end 2023 IPO initial filings have increased a bit, the public/private markets valuation gap still persists.
Prospects for the 2024 IPO Market
If cost-of-capital assumptions drop further as 2024 progresses, the gap may start to close somewhat, possibly resulting in increased IPO volume as the year progresses. For IPO investors, there will likely be potential opportunities for “base hits,” but investors should continue to focus on quality IPO candidates and avoid low-priced companies short on growth or profitability.
Generally, the IPO market does not like volatility in the overall stock market, although, in the past, such volatility can sometimes provide the best chance for retail investors to gain access to recent IPO stocks at temporarily depressed prices. Also, in the United States, 2024 will likely present substantial political election volatility with an uncertain outcome.
In my view, the 2024 U.S. IPO market will continue to face challenges in terms of quality and quantity of investable opportunities. The market will likely proceed at relatively low levels of activity, punctuated with a few high-visibility IPOs throughout the year.
Some likely IPO candidates for 2024 worth noting include payments company Stripe (STRIP), social network firm Reddit (REDDIT), large Chinese online retailer Shein, fast-casual restaurant Panera Bread and Kim Kardashian’s shapewear company Skims, among others.
Coming off a disappointing IPO market return performance in 2023, my enthusiasm continues for the potential of solid growth stocks as a part of an investor’s portfolio, but with a focus on the quality of the company and its growth and earnings prospects. With the prospect of lowered cost-of-capital assumptions resulting in a better stock market environment for high-growth technology companies, I’m cautiously hopeful that the IPO market will improve its performance in 2024.
I’ll continue to highlight IPO companies that I believe are high quality with a discernible path to profitability and quality management teams combined with large addressable markets and a solid revenue growth trajectory. I also will not hesitate to call out poor IPO candidate companies, as I expect they will, unfortunately, continue to be presented to investors. I urge IPO investors to avoid FOMO (Fear Of Missing Out) behaviors and cast a cold and dispassionate eye on IPOs that are heavily hyped in the media world. Avoid $5 or less IPOs and proceed carefully with Asia-Pacific IPO candidates. Investors should focus on quality companies with strong growth, experienced management and reduced operating losses.
Patient, detail-oriented investors who use a “watch list” proactively to track companies while waiting for good entry points stand a chance of outperforming the general market.