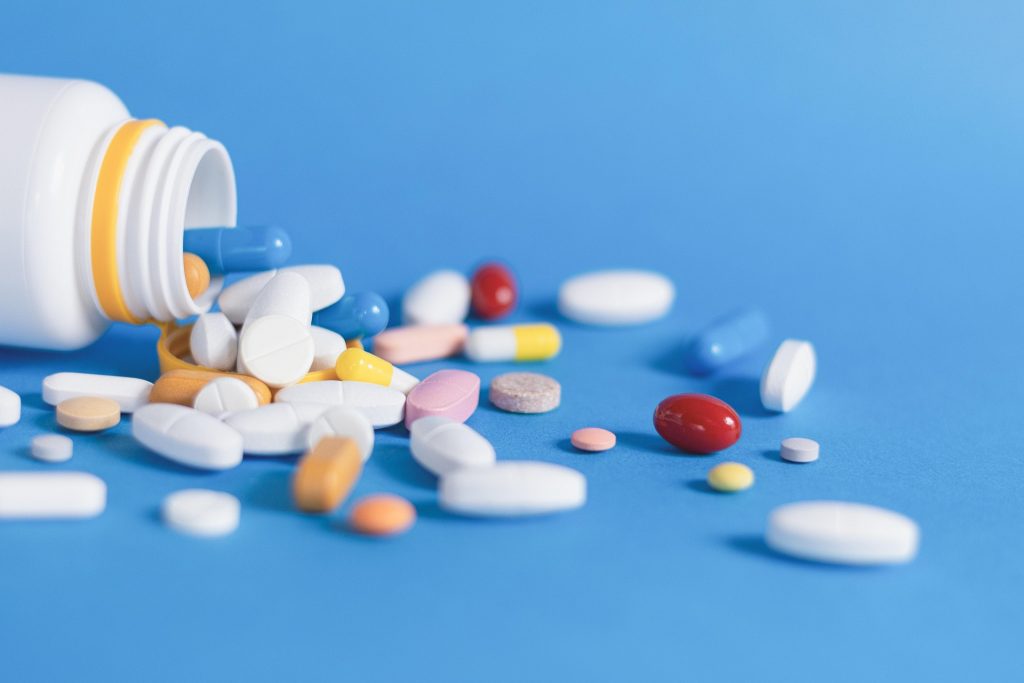
Eli Lilly’s Stock Gains After Promising Obesity Pill Trial Results
Eli Lilly Stock (NYSE: LLY) is experiencing a boost on Thursday, April 17th, following the company’s announcement of favorable results from the first phase of its late-stage trials for a daily obesity pill. The trial met its primary objectives, showcasing the pill’s effectiveness in lowering blood sugar levels and aiding weight reduction in Type 2 diabetes patients. Notably, the pill also displayed a safety profile akin to well-known injectable treatments like Novo Nordisk’s Ozempic.
This promising development marks a significant win for Eli Lilly. The option of a daily pill, as opposed to an injection like Ozempic, could provide a substantial edge should the treatment attain regulatory approval, potentially positioning Eli Lilly ahead of its competitor Novo Nordisk.
With this positive news and the resultant Stock surge, investors may wonder if Eli Lilly is a worthy buy at approximately $820. Our analysis indicates it is. This conclusion stems from a thorough comparison of Eli Lilly’s valuation with its recent operational performance and its present and historical financial standing. Our evaluation looks at critical factors such as Growth, Profitability, Financial Stability, and Downturn Resilience, revealing that Eli Lilly demonstrates exceptionally strong performance and a healthy financial condition.

Pixabay
Comparing Eli Lilly’s Valuation to the S&P 500
When assessing the cost per dollar of sales or profit, LLY Stock appears quite expensive relative to the broader market.
- Eli Lilly holds a price-to-sales (P/S) ratio of 16.6 compared to 2.8 for the S&P 500.
- The stock trades at a price-to-earnings (P/E) ratio of 70, while the S&P 500 averages at 22.
Revenue Growth Trends for Eli Lilly
In recent years, Eli Lilly has experienced significant revenue growth.
- The company’s top line has increased at an average rate of 17.4% over the past three years, versus 6.2% for the S&P 500.
- Eli Lilly’s revenues expanded by 32.0%, rising from $34 billion to $45 billion in the last 12 months, compared to a 5.3% increase for the S&P 500.
- In the most recent quarter, Eli Lilly’s quarterly revenues grew by 44.7%, reaching $14 billion, up from $9.4 billion a year earlier—contrasting with the S&P 500’s 4.9% improvement.
Profitability Analysis of Eli Lilly
Eli Lilly’s profit margins are significantly higher than those of many companies in the Trefis coverage universe.
- The company’s Operating Income over the last four quarters was $18 billion, yielding a robust Operating Margin of 38.9%, significantly higher than the S&P 500’s 13.1%.
Eli Lilly’s Financial Stability
The balance sheet for Eli Lilly appears strong.
- The company had $34 billion in debt at the end of the most recent quarter, with a market capitalization of $661 billion as of April 16, 2025. This results in a favorable Debt-to-Equity Ratio of 4.9%, compared to a less favorable 21.5% for the S&P 500. [Note: A lower Debt-to-Equity Ratio is better]
- Cash and cash equivalents amount to $3.4 billion, making up only 4.3% of Eli Lilly’s total assets of $79 billion, which is lower than the S&P 500 average of 15.0%.
Resilience of LLY Stock in Market Downturns
LLY Stock has shown greater resilience than the S&P 500 during various recent downturns. If you’re concerned about potential market crashes impacting LLY Stock, our detailed analysis via the dashboard “How Low Can Eli Lilly and Stock Go In A Market Crash?” provides insights into historical performances during prior downturns.
Impact of Inflation Shock (2022)
- LLY Stock dropped 15.0% from $276.22 on January 1, 2022, to $234.69 on February 14, 2022, versus a peak-to-trough decline of 25.4% for the S&P 500.
- The stock fully regained its pre-crisis peak by March 16, 2022.
- Since that time, it has surged to a high of $960.02 on September 2, 2024, and currently trades around $730.
Effects of the Covid Pandemic (2020)
- LLY Stock fell by 19.2% from a peak of $147.35 on February 5, 2020, to $119.05 on March 23, 2020, compared to a 33.9% drop in the S&P 500.
- This stock also fully rebounded to its pre-crisis high by April 14, 2020.
Global Financial Crisis (2008)
- LLY Stock faced a decline of 54.6% from $60.56 on April 20, 2007, to $27.47 on March 5, 2009, versus a peak-to-trough fall of 56.8% for the S&P 500.
- The stock eventually recovered to its pre-crisis peak by April 21, 2014.
Overall Summary: Implications for LLY Stock
In conclusion, Eli Lilly’s performance across the outlined metrics points to the following strengths:
- Growth: Extremely Strong
- Profitability: Very Strong
- Financial Stability: Strong
- Resilience During Downturns: Strong
- Overall: Very Strong
Eli Lilly has consistently shown exceptional performance in critical areas. Although its valuation multiples may seem high, this is supported by the company’s solid growth potential and promising drug pipeline. As the demand for obesity treatments rises, Eli Lilly stands out as a key player alongside Novo Nordisk. Additionally, the possible approval of the daily pill for Type 2 diabetes could strengthen its position in the growing diabetes and obesity medication market. Consequently, even after today’s Stock rally, we maintain our view that LLY Stock is a strong buy. Notably, the average analyst price target of $1,008 indicates an upside of over 20% from current levels.
Systematic Strategies & Rules-Based Wealth Management
Trefis employs systematic portfolio strategies that integrate risk management through high-quality investments and active hedges. In partnership with Empirical Asset Management, a rules-based wealth manager, Trefis is offering these strategies to investors. For further information about Trefis strategies or Empirical, please check out this link.
The views and opinions expressed herein are those of the author and do not necessarily reflect those of Nasdaq, Inc.


