Tripadvisor Forecasts Diminished Earnings Amid Strategic Shifts
Tripadvisor Stock (NASDAQ: TRIP) is set to publish its fiscal first-quarter earnings on Wednesday, May 7, 2025. Analysts estimate earnings of 5 cents per share, with anticipated revenues of $388 million. These figures reflect a significant 58% year-over-year reduction in adjusted earnings and a slight 2% decline in sales from the previous year’s results, which were 12 cents per share and $395 million in revenue. Historically, Tripadvisor stock tends to underperform post-earnings announcements, having declined 70% of the time, with a median drop of 7.7% on the first trading day and a maximum decline recorded at 29%.
Company Performance and Future Expectations
The company is focusing on its Experiences segment, where both Viator and TheFork are showing promising results. Conversely, the Brand Tripadvisor segment is experiencing a decline, affected by pressures on its conventional business model. Looking ahead, Tripadvisor expects to maintain growth in the Viator segment, predicting mid to high-teens expansion in booking volume. TheFork is also projected to generate low double-digit revenue growth. However, the Brand Tripadvisor segment may face a slight revenue decline in low single digits.
Currently, Tripadvisor boasts a market capitalization of $1.9 billion. Over the last year, it achieved $1.8 billion in revenue while maintaining operational profitability, showing an operating income of $92 million and a GAAP net income of $5 million.
Strategies for Event-Driven Traders
Traders focusing on event-driven strategies might find historical patterns beneficial, whether positioning themselves ahead of earnings or reacting to post-release movements. For those looking for lower volatility than single stocks, the Trefis High Quality portfolio has outperformed the S&P 500, returning more than 91% since inception. See earnings reaction history of all stocks.
Historical Odds of Post-Earnings Returns
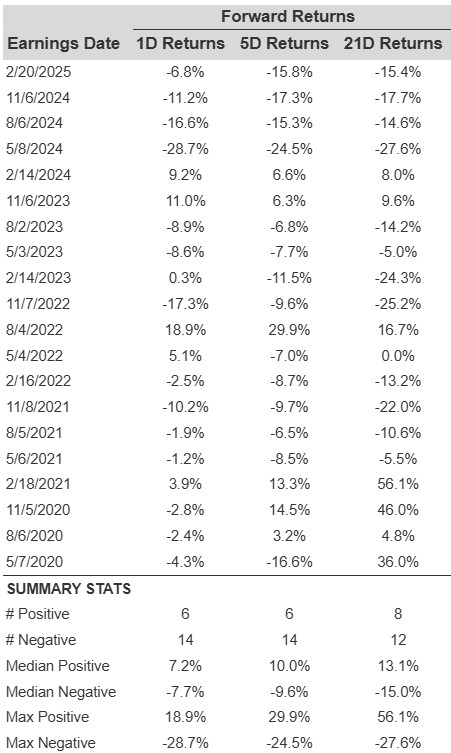
Analyzing one-day (1D) post-earnings returns reveals:
- Out of 20 earnings data points collected over the past five years, there were 6 positives and 14 negatives concerning 1D returns. This results in positive returns occurring about 30% of the time.
- When narrowed to the last three years, this percentage improves to 36%.
- The median of the 6 positive returns sits at 7.2%, while the median of the 14 negative returns stands at -7.7%.
5-day (5D) and 21-day (21D) returns statistics are further summarized in the table below.
Understanding Correlations in Historical Returns
Implementing a relatively less risky strategy involves understanding the correlation between short-term and medium-term returns following earnings. Traders can benefit by identifying pairings with the highest correlation and executing appropriate trades. For instance, if there is a strong correlation between 1D and 5D returns, a trader might go “long” for the next 5 days if the 1D return is positive. Here is the correlation data based on 5-year and the more recent 3-year history.
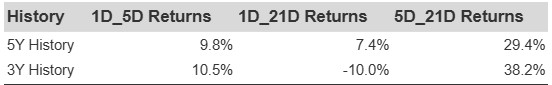
TRIP Correlation Between 1D, 5D and 21D Historical Returns
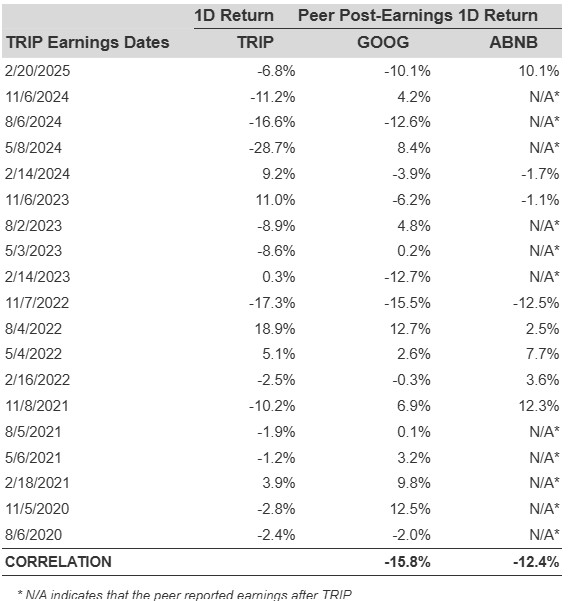
Impact of Peer Earnings on Stock Reactions
The performance of peers can also influence reactions to post-earnings Stock. In some cases, the market begins to price in these shifts before earnings reports are released. Here is historical data showcasing the post-earnings performance of Tripadvisor Stock in relation to peers that reported earnings just before Tripadvisor.’
The views and opinions expressed herein are the views and opinions of the author and do not necessarily reflect those of Nasdaq, Inc.